empty
20.01.2023 07:10 PM
Technical analysis of EUR/USD for January 20, 2023

This image is no longer relevant

Overview :

The expected trend for today: Bullish.

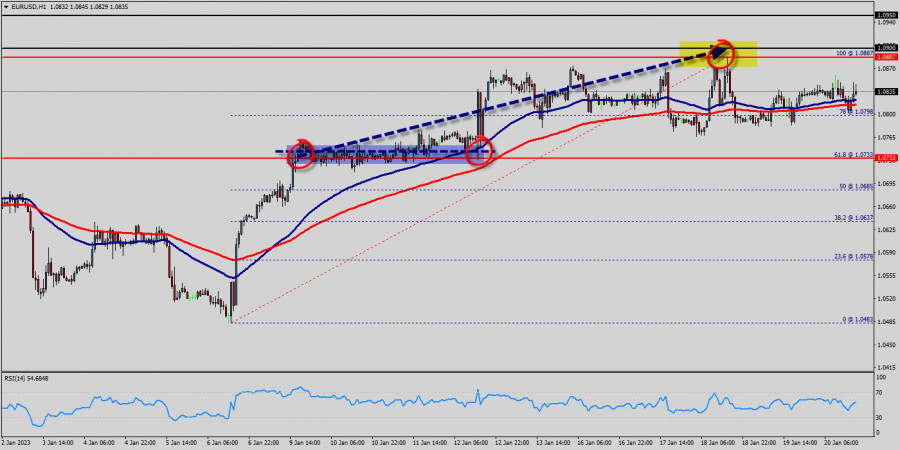
The EUR/USD pair rallied upwards strongly yesterday to breach the bearish channel's resistance and settles above it, opening the way to turn to the upside on the intraday and short-term basis, starting bullish correction for the raise measured from 1.0733 to 1.0835, noting that the first main station is located at 1.0887, which breaching it represents the key to achieve additional gains that reach 1.0900.

Therefore, the bullish bias will be suggested for today, supported by the EMA100 that carries the price from above, taking into consideration that breaking 1.0835 will stop the expected rise and push the price back to the main bearish track again.

A medium term topped could be in place already, on bullish convergence condition in daily RSI.

Intraday bias is now on the upside for 61.8% retracement of 1.0733 to 1.0835 at 1.0887. The EUR/USD pair traded higher and closed the day in the positive territory around 1.0835-1.0887.

On the hourly chart, EUR/USD is still trading above the moving average line MA (100) H1 (1.0835).

Accordingly, the bullish outlook remains the same as long as the EMA 100 is pointing to the uptrend. This suggests that the pair will probably go above the daily pivot point (1.0835) in the coming hours.

The EUR/USD pair will demonstrate strength following a breakout of the high at 1.0835 . The situation is similar on the four-hour chart. Based on the foregoing, it is probably worth sticking to the north direction in trading, and as long as the EUR/USD pair remains above MA100 H1, it may be necessary to look for entry points to buy for the formation of a correction. Probably, the main scenario is continued growth towards 1.0887 (Oct. 26 high). The expected trading range for today is between 1.0733 support and 1.0900 resistance.

Forecast:

Uptrend scenario :

An uptrend will start as soon, as the market rises above resistance level 1.0733, which will be followed by moving up to resistance level 1.0887. Further close above the high end may cause a rally towards 1.0887and 1.0900. Nonetheless, the weekly resistance level and zone should be considered at 1.0900.

Alternative scenario :

On the downside, break of 1.0733 major

support will turn intraday bias neutral first. The breakdown of 1.0733 will allow the pair to down further down to the prices of 1.0700 and 1.0685.

Mourad El Keddani,
الخبير التحليلي لدى شركة إنستافوركس
© 2007-2025
حدد الإطار الزمني
5
د
15
د
30
د
1
س
4
ساعات
1
يوم
1
أسبوع
كسب عائد من تغيرات أسعار العملات المشفرة مع إنستافوركس.
قم بتحميل منصة التداول ميتاتريدر 4 وافتح أول صفقة.
  • Grand Choice
    Contest by
    InstaForex
    InstaForex always strives to help you
    fulfill your biggest dreams.
    انضم إلى المسابقة

المقالات الموصى بها

إشارات التداول للذهب (XAU/USD) للفترة من 14 إلى 17 أبريل 2024: البيع تحت مستوى 3,224 دولار (+1/8 Murray - 21 SMA)

خطة التداول لدينا للساعات القادمة هي بيع الذهب تحت مستوى 3,224، مع تحديد الأهداف عند 3,203 و3,156. يجب أن نكون متيقظين لأي ارتداد تقني، حيث أن النظرة العامة لا تزال

Dimitrios Zappas 15:59 2025-04-14 UTC+2

التوقعات لليورو/الدولار الأمريكي في 14 أبريل 2025

يوم الجمعة، واصل زوج اليورو/الدولار الأمريكي الارتفاع لكنه تراجع في النصف الثاني من اليوم. كان الانخفاض (أي تقوية الدولار) قصير الأمد، وبحلول نهاية يوم الجمعة، سجل الدولار الأمريكي مرة أخرى

Samir Klishi 12:28 2025-04-14 UTC+2

التوقعات لزوج الجنيه الإسترليني/الدولار الأمريكي في 14 أبريل 2025

على الرسم البياني الساعي، واصل زوج الجنيه الإسترليني/الدولار الأمريكي حركته الصعودية يوم الجمعة، واليوم في طريقه للوصول إلى مستوى 1.3151. الارتداد من هذا المستوى سيفضل الدولار الأمريكي وقد يؤدي

Samir Klishi 12:25 2025-04-14 UTC+2

التحليل الفني لحركة السعر اللحظية لأداة سلعة النفط الخام، الاثنين 24 أبريل 2025.

على الرسم البياني لمدة 4 ساعات لأداة سلعة النفط الخام، يظهر نمط الرأس والكتفين المقلوب ونمط الصعود 123 والتباين بين حركة سعر #CL ومؤشر مذبذب ستوكاستيك، بالإضافة إلى أن حركة

Arief Makmur 07:19 2025-04-14 UTC+2

التحليل الفني لحركة السعر اللحظية لأداة السلع البلاديوم مقابل الدولار الأمريكي، الاثنين 24 أبريل 2025.

مع ظهور تباعد من مؤشر Stochastic Oscillator مع حركة سعر XPD/USD على الرسم البياني لمدة 4 ساعات وظهور نمط Bullish 123 متبوعًا بحركة السعر فوق EMA (21)، فإن ذلك يعطي

Arief Makmur 07:19 2025-04-14 UTC+2

#SPX – ملخص وتوقعات

في الأسبوع الماضي، على الرغم من وجود فجوة هبوطية، تمكن اللاعبون الصاعدون من استعادة مواقعهم بفعالية. يقترب السوق الآن من النقطة التي قد يتمكن فيها من إلغاء تقاطع الموت اليومي

Evangelos Poulakis 00:58 2025-04-14 UTC+2

إشارات التداول لليورو/الدولار الأمريكي للفترة من 11 إلى 15 أبريل 2025: بيع تحت 1.1470 (+2/8 Murray - تشبع شرائي)

خلال الجلسة الأوروبية، وصل اليورو إلى مستوى مرتفع جديد حول +2/8 موراي، الموجود عند 1.1473. حدثت هذه الحركة في زوج اليورو/الدولار الأمريكي بعد إعلان وزارة المالية الصينية أن بكين سترفع

Dimitrios Zappas 16:44 2025-04-11 UTC+2

إشارات التداول للذهب (XAU/USD) للفترة من 11 إلى 13 أبريل 2025: البيع تحت مستوى 3,235 دولار (+1/8 Murray - تشبع شرائي)

في بداية الجلسة الأمريكية، يشهد الذهب تصحيحًا تقنيًا قويًا بعد أن وصل إلى مستوى مرتفع جديد حوالي 3,237.69 في الوقت الحالي. سيتم إصدار البيانات الاقتصادية من الولايات المتحدة في غضون

Dimitrios Zappas 16:04 2025-04-11 UTC+2

اليورو/الدولار الأمريكي – 11 أبريل. تراجع الدولار لا يظهر أي علامة على التوقف

يوم الخميس، قضى زوج اليورو/الدولار الأمريكي اليوم بأكمله في حركة صعودية، مكتسبًا 400 نقطة واقترب من مستوى التصحيح 261.8% فيبوناتشي عند 1.1318. قد يؤدي الارتداد من هذا المستوى

Samir Klishi 12:36 2025-04-11 UTC+2

التوقعات لزوج الجنيه الإسترليني/الدولار الأمريكي في 11 أبريل 2025

على الرسم البياني للساعة، واصل زوج الجنيه الإسترليني/الدولار الأمريكي حركته الصعودية يوم الخميس وتمكن من تأمين موقع فوق مستوى التصحيح 127.2% عند 1.3003 - بحلول صباح الجمعة. وهذا يشير

Samir Klishi 12:32 2025-04-11 UTC+2
لا تستطيع التحدث الآن؟
اطرح سؤالك في الدردشة.
Widget callback
 

Dear visitor,

Your IP address shows that you are currently located in the USA. If you are a resident of the United States, you are prohibited from using the services of InstaFintech Group including online trading, online transfers, deposit/withdrawal of funds, etc.

If you think you are seeing this message by mistake and your location is not the US, kindly proceed to the website. Otherwise, you must leave the website in order to comply with government restrictions.

Why does your IP address show your location as the USA?

  • - you are using a VPN provided by a hosting company based in the United States;
  • - your IP does not have proper WHOIS records;
  • - an error occurred in the WHOIS geolocation database.

Please confirm whether you are a US resident or not by clicking the relevant button below. If you choose the wrong option, being a US resident, you will not be able to open an account with InstaForex anyway.

We are sorry for any inconvenience caused by this message.