empty
24.03.2023 10:21 AM
EUR/USD and GBP/USD: trading plan for beginners on March 24, 2023

Macroeconomic calendar from March 23

At a monetary policy meeting yesterday, the Bank of England raised interest rates by 25 basis points to 4.25%, the highest rates since October 2008. Back then, interest rates were at 4.50%. The increase came due to persistent inflation. In February and January, consumer prices accelerated to 10.4% and 10.1% respectively. Meanwhile, economists had expected inflation to slow down in February. However, the latest press release hints at a possible end of the tightening cycle in the near term. So, it may be that we will soon see the regulator pause tightening.

Overview of technical charts from March 23

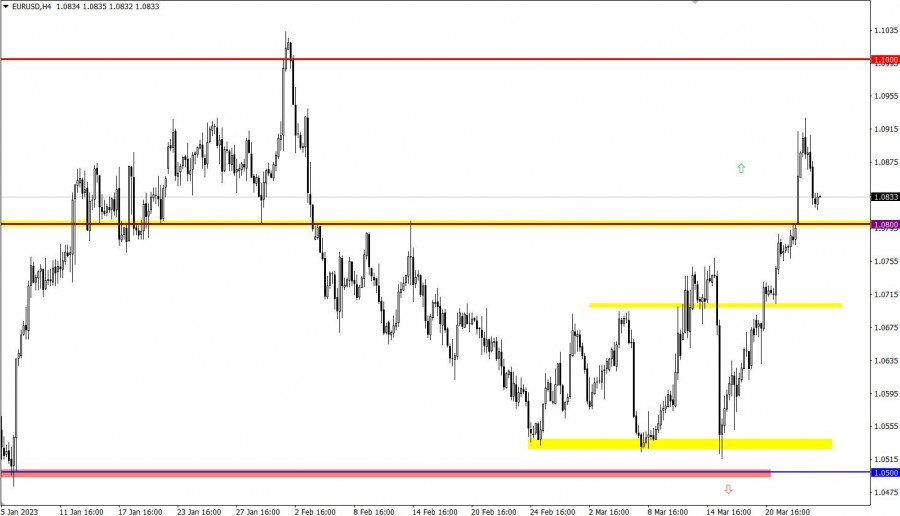
EUR/USD has gained over 250 pips since the beginning of the week. That triggered a horizontal movement with a signal to buy EUR. The volume of long positions decreased and the price retreated.

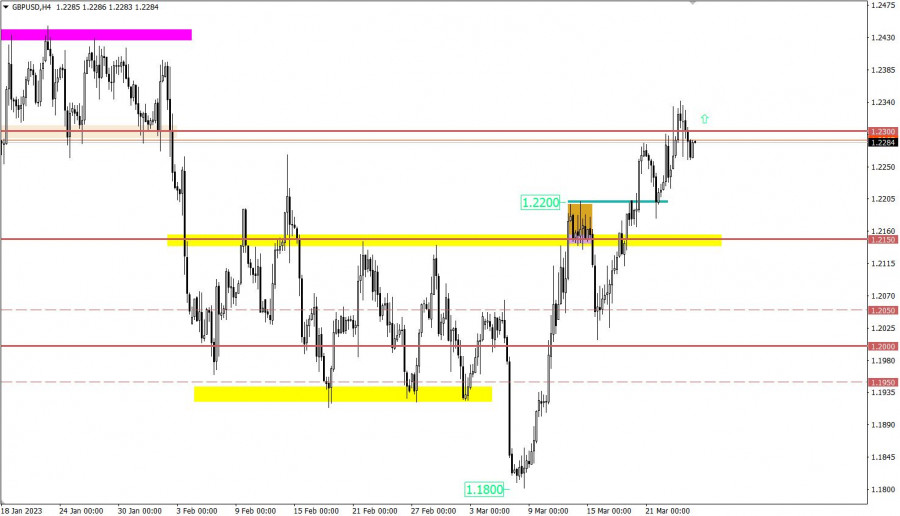
Once 1.2300 resistance was reached, GBP/USD pulled back somewhat. Nevertheless, the bull trend goes on. The pound has recouped almost all losses incurred in February.

This image is no longer relevant

Macroeconomic calendar on March 24

With the opening of European trade, UK retail sales came in, showing a rise to -3.5% versus -5.4% year-on-year. On a monthly basis, figures grew by 1.2%.

Today, a series of business activity reports will be delivered in the eurozone, the United States, and the United Kingdom. Economists expect figures to decline across the board.

Trading plan for EUR/USD on March 24

EUR/USD retreated to 1.0800 support. The price may rebound from this mark with a rise in buying volumes.

Alternatively, EUR/USD may go down if quotes stay below 1.0800 intraday.

This image is no longer relevant

Trading plan for GBP/USD on March 24

A pullback may cause a shift in sentiment. Should the price go above 1.2300, it would generate a signal to buy GBP. This could lead to a bullish continuation, and the pair could update the swing high of the medium-term trend.

Alternatively, if quotes fall below 1.2200, it will mark the rise of a downtrend.

This image is no longer relevant

What's on technical charts

The candlestick chart shows graphical white and black rectangles with upward and downward lines. While conducting a detailed analysis of each individual candlestick, it is possible to notice its features intrinsic to a particular time frame: the opening price, the closing price, and the highest and lowest price.

Horizontal levels are price levels, in relation to which a stop or reversal of the price may occur. They are called support and resistance levels.

Circles and rectangles are highlighted examples where the price reversed in the course of its history. This color highlighting indicates horizontal lines which can exert pressure on prices in the future.

Upward/downward arrows signal a possible future price direction.

Gven Podolsky,
الخبير التحليلي لدى شركة إنستافوركس
© 2007-2025
حدد الإطار الزمني
5
د
15
د
30
د
1
س
4
ساعات
1
يوم
1
أسبوع
كسب عائد من تغيرات أسعار العملات المشفرة مع إنستافوركس.
قم بتحميل منصة التداول ميتاتريدر 4 وافتح أول صفقة.
  • Grand Choice
    Contest by
    InstaForex
    InstaForex always strives to help you
    fulfill your biggest dreams.
    انضم إلى المسابقة

المقالات الموصى بها

كيفية تداول زوج اليورو/الدولار الأمريكي في 4 يوليو؟ نصائح بسيطة وتحليل التداول للمبتدئين

تداول زوج العملات EUR/USD طوال يوم الخميس، سواء قبل أو بعد نشر بيانات الوظائف غير الزراعية ومعدل البطالة في الولايات المتحدة. لوحظت حركة مسطحة تمامًا قبل وبعد صدور البيانات الاقتصادية

Paolo Greco 06:34 2025-07-04 UTC+2

توصيات وتحليل التداول لزوج الجنيه الإسترليني/الدولار الأمريكي في 4 يوليو: ارتفع الدولار — ثم انخفض مرة أخرى

أظهر زوج العملات GBP/USD يوم الخميس تحركات تكاد تكون متطابقة مع زوج العملات EUR/USD. وهذا ليس مفاجئًا، حيث أنه خلال الأشهر الخمسة الماضية لم يكن اليورو أو الجنيه الإسترليني

Paolo Greco 03:56 2025-07-04 UTC+2

توصيات وتحليل التداول لليورو/الدولار الأمريكي في 4 يوليو: يوم استقلال الولايات المتحدة

تداول زوج العملات EUR/USD بشكل ملحوظ يوم الخميس. طوال معظم اليوم، شهدنا حركة جانبية منخفضة التقلبات، وبمجرد صدور بيانات سوق العمل والبطالة الأمريكية، انخفض السعر بشكل

Paolo Greco 03:56 2025-07-04 UTC+2

GBP/USD: خطة التداول للجلسة الأمريكية في 3 يوليو (مراجعة تداولات الصباح)

في توقعاتي الصباحية، ركزت على مستوى 1.3659 وخططت لاتخاذ قرارات التداول بناءً عليه. دعونا نلقي نظرة على الرسم البياني لمدة 5 دقائق ونراجع ما حدث. ارتفع السعر وشكل اختراقًا كاذبًا

Miroslaw Bawulski 15:34 2025-07-03 UTC+2

EUR/USD: خطة التداول للجلسة الأمريكية في 3 يوليو (مراجعة التداولات الصباحية)

في توقعاتي الصباحية، أشرت إلى مستوى 1.1784 كنقطة مرجعية رئيسية لدخول السوق. دعونا نلقي نظرة على الرسم البياني لمدة 5 دقائق ونحلل ما حدث هناك. لقد انخفض السعر باتجاه مستوى

Miroslaw Bawulski 15:29 2025-07-03 UTC+2

كيفية تداول زوج الجنيه الإسترليني/الدولار الأمريكي في 3 يوليو؟ نصائح بسيطة وتحليل التداول للمبتدئين

يوم الأربعاء، انخفض زوج الجنيه الإسترليني/الدولار الأمريكي بشكل حاد كما لو كان حجرًا يسقط من ناطحة سحاب، مما دفع محللي العملات للبحث فورًا عن الأسباب وراء هذا الانخفاض. ومع ذلك،

Paolo Greco 06:53 2025-07-03 UTC+2

كيفية تداول زوج اليورو/الدولار الأمريكي في 3 يوليو؟ نصائح بسيطة وتحليل التداول للمبتدئين

في يوم الأربعاء، حاول زوج العملات EUR/USD بدء جولة جديدة من التصحيح الهبوطي، ونتيجة هذه المحاولة واضحة على أي إطار زمني. الدولار الأمريكي، على الرغم من ارتفاعه،

Paolo Greco 06:33 2025-07-03 UTC+2

توصيات وتحليل التداول لزوج الجنيه الإسترليني/الدولار الأمريكي في 3 يوليو: تلاعب من أجل انطلاقة جديدة؟

يوم الأربعاء، انهار زوج العملات GBP/USD دون سبب واضح. لم تكن هناك أخبار رئيسية في المملكة المتحدة أو الولايات المتحدة يمكن أن تؤدي إلى انخفاض قيمة الجنيه الإسترليني بنحو

Paolo Greco 03:45 2025-07-03 UTC+2

توصيات وتحليل التداول لليورو/الدولار الأمريكي في 3 يوليو: اليورو يصمد، والجنيه يتراجع

في يوم الأربعاء، تراجع زوج العملات EUR/USD بشكل طفيف ولكنه لم يظهر أي ميل لمتابعة الجنيه الإسترليني، الذي انهار بنحو 200 نقطة. بقي اليورو فوق خط Kijun-sen الحرج ومستوى 1.1750،

Paolo Greco 03:45 2025-07-03 UTC+2

GBP/USD: استراتيجية للجلسة الأمريكية في 2 يوليو (تحليل التداولات الصباحية)

في توقعاتي الصباحية، ركزت على مستوى 1.3713 وخططت لاتخاذ قرارات التداول بناءً عليه. دعونا نلقي نظرة على الرسم البياني لمدة 5 دقائق ونفحص ما حدث. على الرغم من كسر مستوى

Miroslaw Bawulski 18:28 2025-07-02 UTC+2
لا تستطيع التحدث الآن؟
اطرح سؤالك في الدردشة.
Widget callback
 

Dear visitor,

Your IP address shows that you are currently located in the USA. If you are a resident of the United States, you are prohibited from using the services of InstaFintech Group including online trading, online transfers, deposit/withdrawal of funds, etc.

If you think you are seeing this message by mistake and your location is not the US, kindly proceed to the website. Otherwise, you must leave the website in order to comply with government restrictions.

Why does your IP address show your location as the USA?

  • - you are using a VPN provided by a hosting company based in the United States;
  • - your IP does not have proper WHOIS records;
  • - an error occurred in the WHOIS geolocation database.

Please confirm whether you are a US resident or not by clicking the relevant button below. If you choose the wrong option, being a US resident, you will not be able to open an account with InstaForex anyway.

We are sorry for any inconvenience caused by this message.