

signal strength 1 of 5
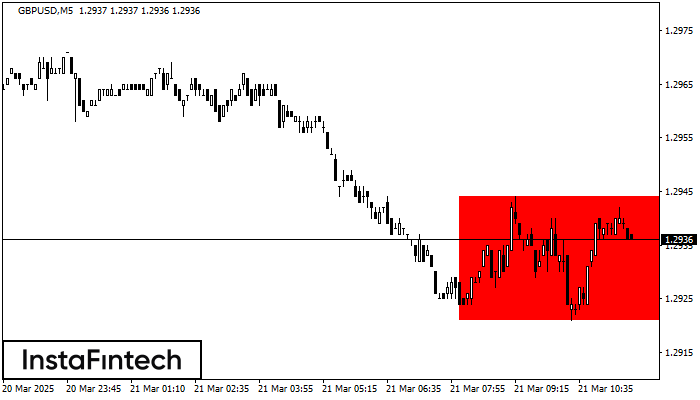
According to the chart of M5, GBPUSD formed the Bearish Rectangle. The pattern indicates a trend continuation. The upper border is 1.2944, the lower border is 1.2921. The signal means that a short position should be opened after fixing a price below the lower border 1.2921 of the Bearish Rectangle.
The M5 and M15 time frames may have more false entry points.
- All
- Double Top
- Flag
- Head and Shoulders
- Pennant
- Rectangle
- Triangle
- Triple top
- All
- #AAPL
- #AMZN
- #Bitcoin
- #EBAY
- #FB
- #GOOG
- #INTC
- #KO
- #MA
- #MCD
- #MSFT
- #NTDOY
- #PEP
- #TSLA
- #TWTR
- AUDCAD
- AUDCHF
- AUDJPY
- AUDUSD
- EURCAD
- EURCHF
- EURGBP
- EURJPY
- EURNZD
- EURRUB
- EURUSD
- GBPAUD
- GBPCHF
- GBPJPY
- GBPUSD
- GOLD
- NZDCAD
- NZDCHF
- NZDJPY
- NZDUSD
- SILVER
- USDCAD
- USDCHF
- USDJPY
- USDRUB
- All
- M5
- M15
- M30
- H1
- D1
- All
- Buy
- Sale
- All
- 1
- 2
- 3
- 4
- 5
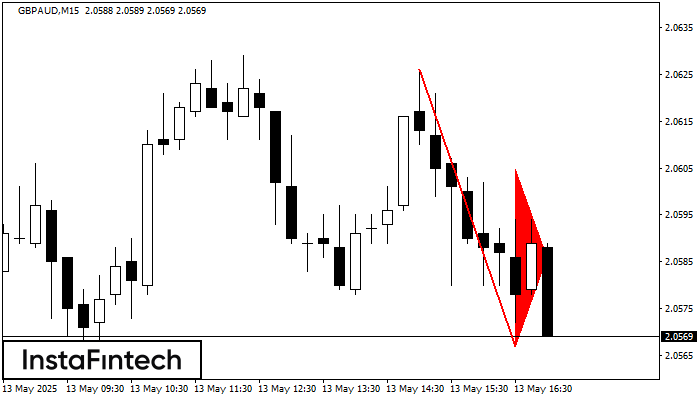
The Bearish pennant pattern has formed on the GBPAUD M15 chart. It signals potential continuation of the existing trend. Specifications: the pattern’s bottom has the coordinate of 2.0567; the projection
The M5 and M15 time frames may have more false entry points.
Open chart in a new window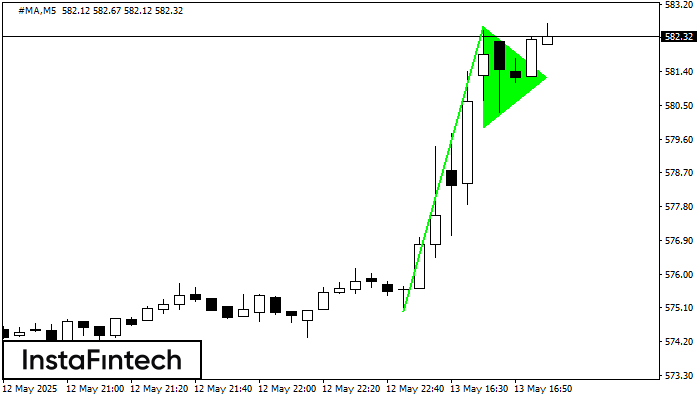
The Bullish pennant graphic pattern has formed on the #MA M5 instrument. This pattern type falls under the category of continuation patterns. In this case, if the quote can breaks
The M5 and M15 time frames may have more false entry points.
Open chart in a new window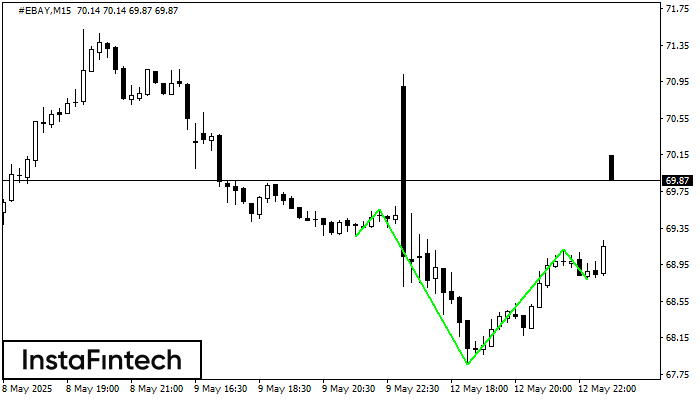
According to the chart of M15, #EBAY produced the pattern termed the Inverse Head and Shoulder. The Head is fixed at 67.86 while the median line of the Neck
The M5 and M15 time frames may have more false entry points.
Open chart in a new window


