


signal strength 1 of 5
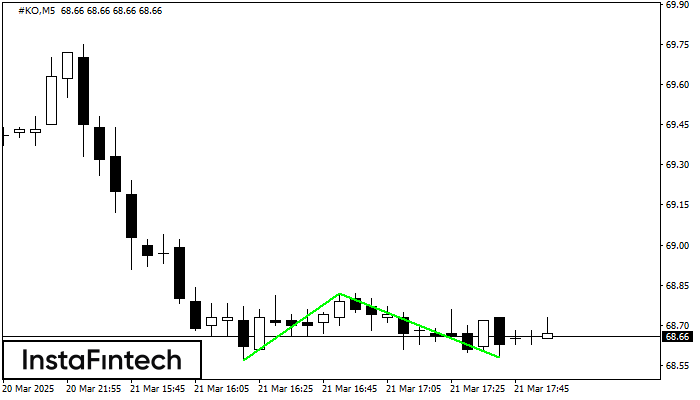
The Double Bottom pattern has been formed on #KO M5. This formation signals a reversal of the trend from downwards to upwards. The signal is that a buy trade should be opened after the upper boundary of the pattern 68.82 is broken. The further movements will rely on the width of the current pattern 25 points.
The M5 and M15 time frames may have more false entry points.
- All
- Double Top
- Flag
- Head and Shoulders
- Pennant
- Rectangle
- Triangle
- Triple top
- All
- #AAPL
- #AMZN
- #Bitcoin
- #EBAY
- #FB
- #GOOG
- #INTC
- #KO
- #MA
- #MCD
- #MSFT
- #NTDOY
- #PEP
- #TSLA
- #TWTR
- AUDCAD
- AUDCHF
- AUDJPY
- AUDUSD
- EURCAD
- EURCHF
- EURGBP
- EURJPY
- EURNZD
- EURRUB
- EURUSD
- GBPAUD
- GBPCHF
- GBPJPY
- GBPUSD
- GOLD
- NZDCAD
- NZDCHF
- NZDJPY
- NZDUSD
- SILVER
- USDCAD
- USDCHF
- USDJPY
- USDRUB
- All
- M5
- M15
- M30
- H1
- D1
- All
- Buy
- Sale
- All
- 1
- 2
- 3
- 4
- 5
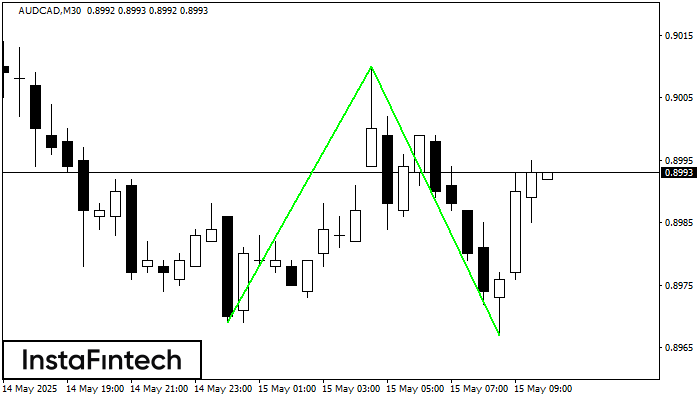
Сформирована фигура «Двойное дно» на графике AUDCAD M30. Характеристика: Уровень поддержки 0.8969; Уровень сопротивления 0.9010; Ширина фигуры 41 пунктов. В случае пробоя уровня сопротивления можно будет прогнозировать изменение тенденции
Открыть график инструмента в новом окне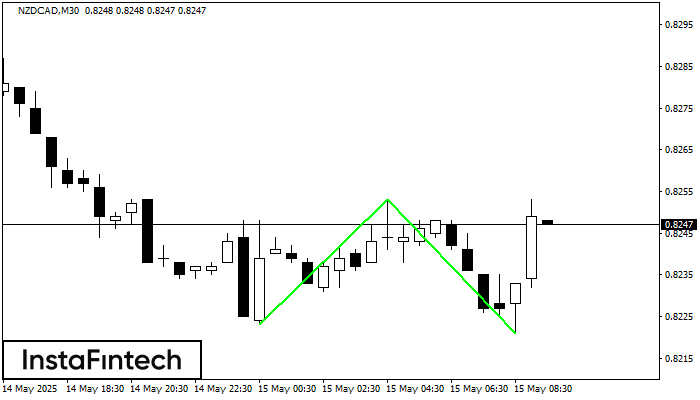
Сформирована фигура «Двойное дно» на графике NZDCAD M30. Характеристика: Уровень поддержки 0.8223; Уровень сопротивления 0.8253; Ширина фигуры 30 пунктов. В случае пробоя уровня сопротивления можно будет прогнозировать изменение тенденции
Открыть график инструмента в новом окне
По GBPJPY M5 сформировалась фигура - «Прямоугольник». Фигура данного типа относится к тому типу продолжения тренда, который имеет два уровня: Сопротивление 194.04; Поддержка 193.84. В случае пробоя уровня поддержки 193.84
Таймфреймы М5 и М15 могут иметь больше ложных точек входа.
Открыть график инструмента в новом окне


