


signal strength 2 of 5
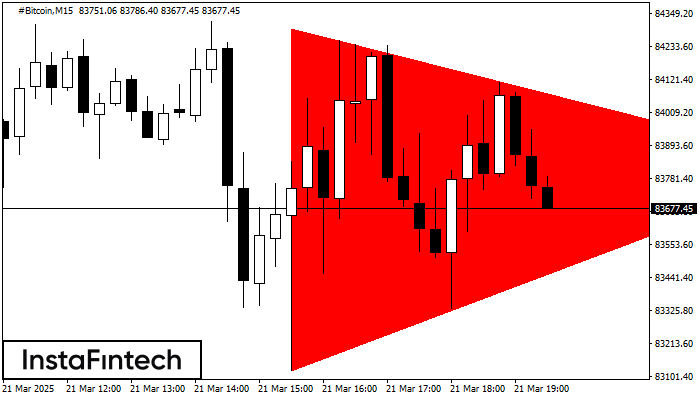
According to the chart of M15, #Bitcoin formed the Bearish Symmetrical Triangle pattern. Description: The lower border is 83121.29/83823.64 and upper border is 84297.08/83823.64. The pattern width is measured on the chart at -117579 pips. The formation of the Bearish Symmetrical Triangle pattern evidently signals a continuation of the downward trend. In other words, if the scenario comes true and #Bitcoin breaches the lower border, the price could continue its move toward 83823.41.
The M5 and M15 time frames may have more false entry points.
- All
- Double Top
- Flag
- Head and Shoulders
- Pennant
- Rectangle
- Triangle
- Triple top
- All
- #AAPL
- #AMZN
- #Bitcoin
- #EBAY
- #FB
- #GOOG
- #INTC
- #KO
- #MA
- #MCD
- #MSFT
- #NTDOY
- #PEP
- #TSLA
- #TWTR
- AUDCAD
- AUDCHF
- AUDJPY
- AUDUSD
- EURCAD
- EURCHF
- EURGBP
- EURJPY
- EURNZD
- EURRUB
- EURUSD
- GBPAUD
- GBPCHF
- GBPJPY
- GBPUSD
- GOLD
- NZDCAD
- NZDCHF
- NZDJPY
- NZDUSD
- SILVER
- USDCAD
- USDCHF
- USDJPY
- USDRUB
- All
- M5
- M15
- M30
- H1
- D1
- All
- Buy
- Sale
- All
- 1
- 2
- 3
- 4
- 5
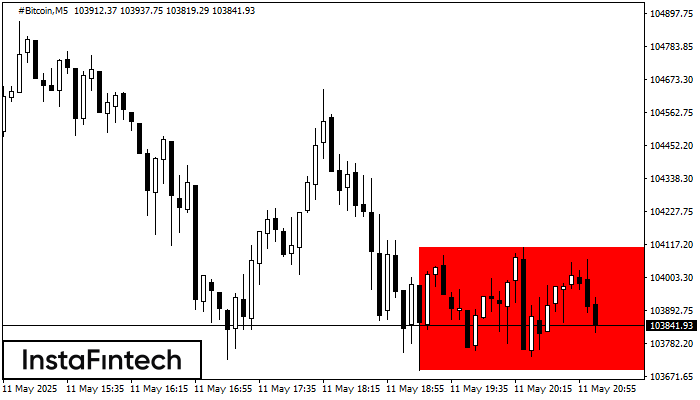
По торговому инструменту #Bitcoin на M5 сформировалась фигура продолжения тренда - «Прямоугольник». Фигура имеет границы: Нижняя 103691.15; Верхняя 104107.73. В случае пробоя нижней границы вероятно дальнейшее движение в сторону тренда
Таймфреймы М5 и М15 могут иметь больше ложных точек входа.
Открыть график инструмента в новом окне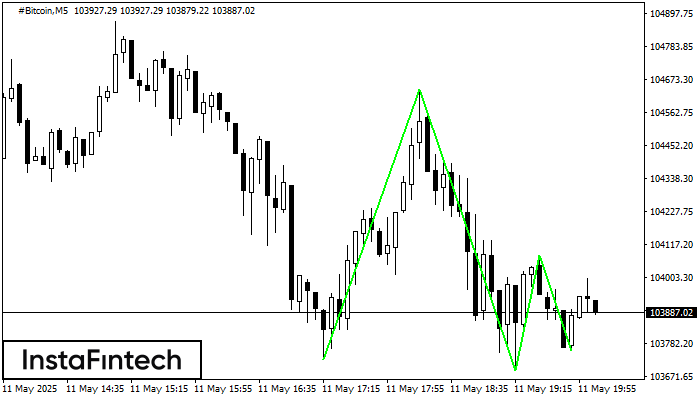
По #Bitcoin на M5 сформировалась фигура «Тройное дно». Характеристика: Нижняя граница фигуры имеет координаты 103759.29, при этом верхняя граница 104640.24/104078.48. Проекция ширины 94909 пунктов. Формирование фигуры «Тройное дно» наиболее вероятным
Таймфреймы М5 и М15 могут иметь больше ложных точек входа.
Открыть график инструмента в новом окне
Сформирована фигура «Двойное дно» на графике #Bitcoin M5. Верхняя граница 104640.24; Нижняя граница 103691.15; Ширина фигуры 91343 пунктов. В случае пробоя верхней границы 104640.24 можно будет прогнозировать изменение тенденции
Таймфреймы М5 и М15 могут иметь больше ложных точек входа.
Открыть график инструмента в новом окне


