


signal strength 1 of 5

The Triple Top pattern has formed on the chart of the #Bitcoin M5 trading instrument. It is a reversal pattern featuring the following characteristics: resistance level 50, support level -21012, and pattern’s width 47477. Forecast If the price breaks through the support level 82165.38, it is likely to move further down to 82748.85.
The M5 and M15 time frames may have more false entry points.
- All
- Double Top
- Flag
- Head and Shoulders
- Pennant
- Rectangle
- Triangle
- Triple top
- All
- #AAPL
- #AMZN
- #Bitcoin
- #EBAY
- #FB
- #GOOG
- #INTC
- #KO
- #MA
- #MCD
- #MSFT
- #NTDOY
- #PEP
- #TSLA
- #TWTR
- AUDCAD
- AUDCHF
- AUDJPY
- AUDUSD
- EURCAD
- EURCHF
- EURGBP
- EURJPY
- EURNZD
- EURRUB
- EURUSD
- GBPAUD
- GBPCHF
- GBPJPY
- GBPUSD
- GOLD
- NZDCAD
- NZDCHF
- NZDJPY
- NZDUSD
- SILVER
- USDCAD
- USDCHF
- USDJPY
- USDRUB
- All
- M5
- M15
- M30
- H1
- D1
- All
- Buy
- Sale
- All
- 1
- 2
- 3
- 4
- 5
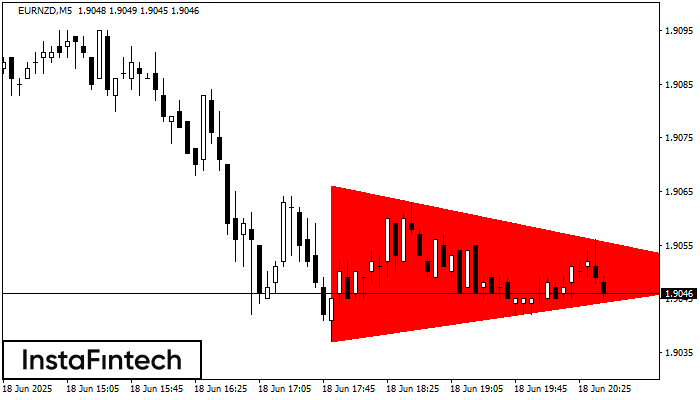
According to the chart of M5, EURNZD formed the Bearish Symmetrical Triangle pattern. Trading recommendations: A breach of the lower border 1.9037 is likely to encourage a continuation
The M5 and M15 time frames may have more false entry points.
Open chart in a new window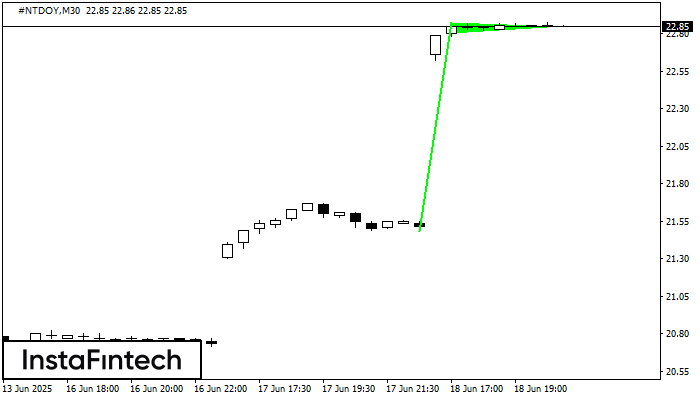
The Bullish pennant signal – Trading instrument #NTDOY M30, continuation pattern. Forecast: it is possible to set up a buy position above the pattern’s high of 22.88, with the prospect
Open chart in a new window
The Bullish pennant signal – Trading instrument #NTDOY M30, continuation pattern. Forecast: it is possible to set up a buy position above the pattern’s high of 22.88, with the prospect
Open chart in a new window


