

signal strength 1 of 5
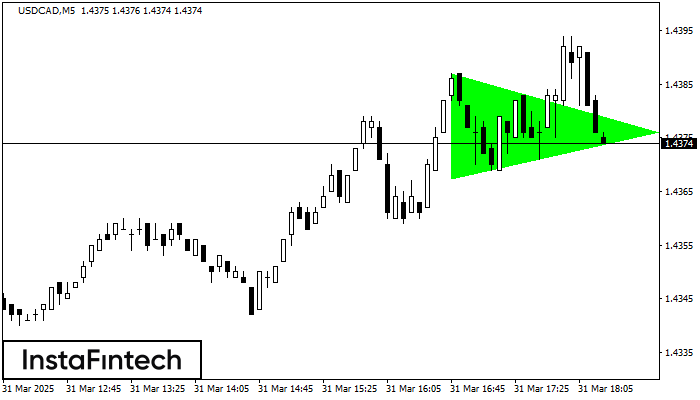
According to the chart of M5, USDCAD formed the Bullish Symmetrical Triangle pattern. Description: This is the pattern of a trend continuation. 1.4387 and 1.4367 are the coordinates of the upper and lower borders respectively. The pattern width is measured on the chart at 20 pips. Outlook: If the upper border 1.4387 is broken, the price is likely to continue its move by 1.4391.
The M5 and M15 time frames may have more false entry points.
انظر أيضا
- All
- Double Top
- Flag
- Head and Shoulders
- Pennant
- Rectangle
- Triangle
- Triple top
- All
- #AAPL
- #AMZN
- #Bitcoin
- #EBAY
- #FB
- #GOOG
- #INTC
- #KO
- #MA
- #MCD
- #MSFT
- #NTDOY
- #PEP
- #TSLA
- #TWTR
- AUDCAD
- AUDCHF
- AUDJPY
- AUDUSD
- EURCAD
- EURCHF
- EURGBP
- EURJPY
- EURNZD
- EURRUB
- EURUSD
- GBPAUD
- GBPCHF
- GBPJPY
- GBPUSD
- GOLD
- NZDCAD
- NZDCHF
- NZDJPY
- NZDUSD
- SILVER
- USDCAD
- USDCHF
- USDJPY
- USDRUB
- All
- M5
- M15
- M30
- H1
- D1
- All
- Buy
- Sale
- All
- 1
- 2
- 3
- 4
- 5

Theo biểu đồ của M5, GBPAUD đã hình thành mô hình Tam giác Cân Tăng, điều mà báo hiệu xu hướng sẽ tiếp tục. Mô tả. Đường biên giới
Khung thời gian M5 và M15 có thể có nhiều điểm vào lệnh sai hơn.
Open chart in a new window
Theo biểu đồ của M5, #TSLA đã hình thành mô hình Tam giác Cân Giảm. Khuyến nghị giao dịch: Việc vi phạm biên giới thấp hơn 313.81 có khả năng
Khung thời gian M5 và M15 có thể có nhiều điểm vào lệnh sai hơn.
Open chart in a new window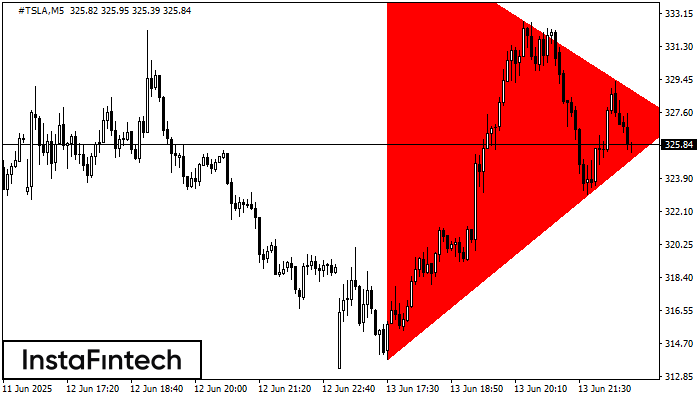
Theo biểu đồ của M5, #TSLA đã hình thành mô hình Tam giác Cân Giảm. Mô hình này báo hiệu xu hướng giảm hơn nữa trong trường hợp đường biên
Khung thời gian M5 và M15 có thể có nhiều điểm vào lệnh sai hơn.
Open chart in a new window


