

signal strength 1 of 5
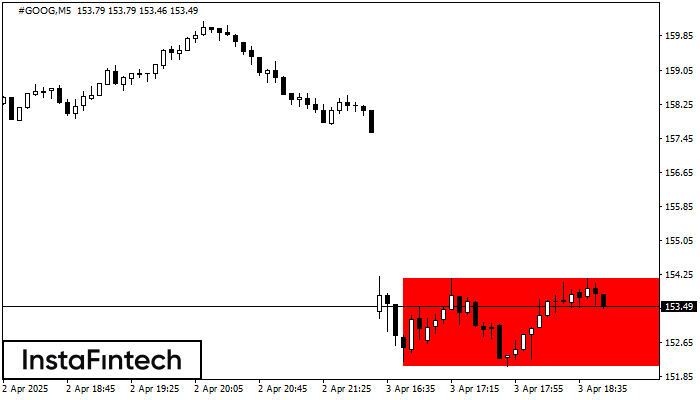
According to the chart of M5, #GOOG formed the Bearish Rectangle. The pattern indicates a trend continuation. The upper border is 154.17, the lower border is 152.10. The signal means that a short position should be opened after fixing a price below the lower border 152.10 of the Bearish Rectangle.
The M5 and M15 time frames may have more false entry points.
انظر أيضا
- All
- Double Top
- Flag
- Head and Shoulders
- Pennant
- Rectangle
- Triangle
- Triple top
- All
- #AAPL
- #AMZN
- #Bitcoin
- #EBAY
- #FB
- #GOOG
- #INTC
- #KO
- #MA
- #MCD
- #MSFT
- #NTDOY
- #PEP
- #TSLA
- #TWTR
- AUDCAD
- AUDCHF
- AUDJPY
- AUDUSD
- EURCAD
- EURCHF
- EURGBP
- EURJPY
- EURNZD
- EURRUB
- EURUSD
- GBPAUD
- GBPCHF
- GBPJPY
- GBPUSD
- GOLD
- NZDCAD
- NZDCHF
- NZDJPY
- NZDUSD
- SILVER
- USDCAD
- USDCHF
- USDJPY
- USDRUB
- All
- M5
- M15
- M30
- H1
- D1
- All
- Buy
- Sale
- All
- 1
- 2
- 3
- 4
- 5
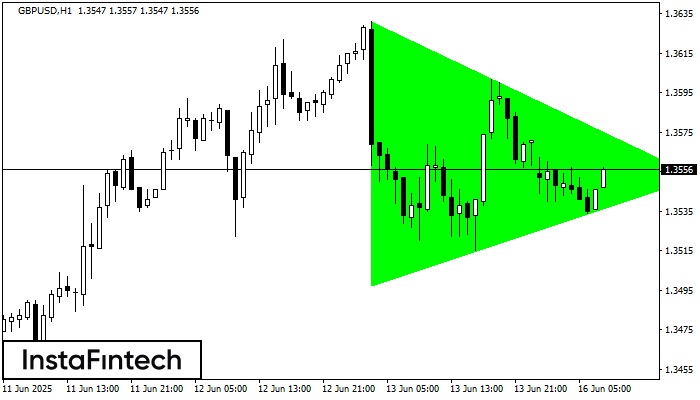
According to the chart of H1, GBPUSD formed the Bullish Symmetrical Triangle pattern. Description: This is the pattern of a trend continuation. 1.3631 and 1.3497 are the coordinates
Open chart in a new window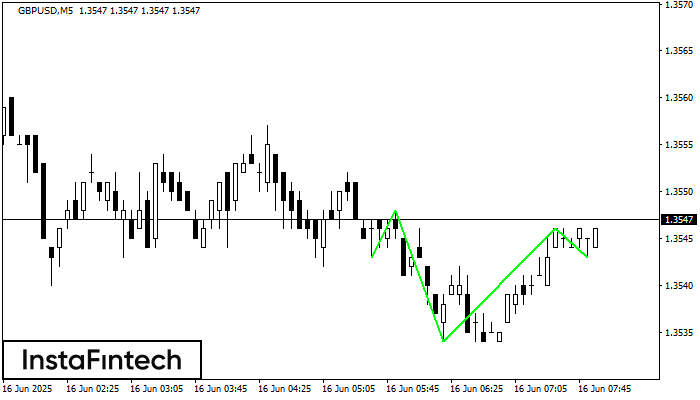
According to the chart of M5, GBPUSD produced the pattern termed the Inverse Head and Shoulder. The Head is fixed at 1.3534 while the median line of the Neck
The M5 and M15 time frames may have more false entry points.
Open chart in a new window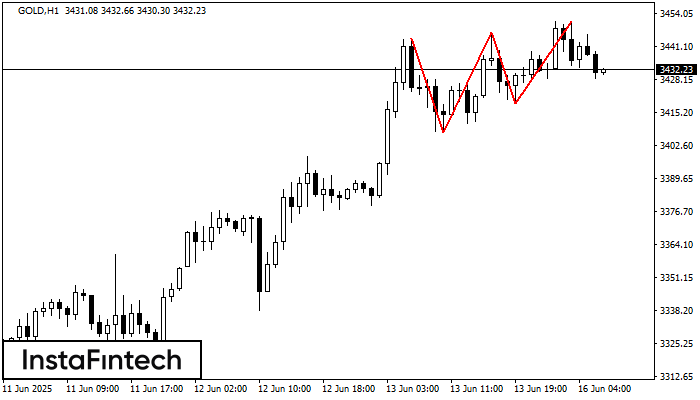
The Triple Top pattern has formed on the chart of the GOLD H1. Features of the pattern: borders have an ascending angle; the lower line of the pattern
Open chart in a new window


