

signal strength 1 of 5
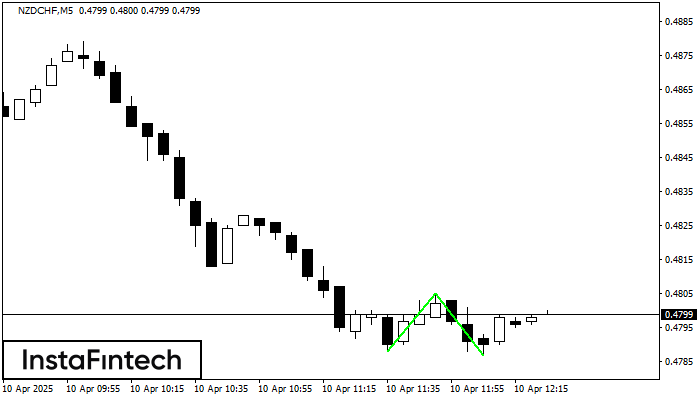
The Double Bottom pattern has been formed on NZDCHF M5. Characteristics: the support level 0.4788; the resistance level 0.4805; the width of the pattern 17 points. If the resistance level is broken, a change in the trend can be predicted with the first target point lying at the distance of 18 points.
The M5 and M15 time frames may have more false entry points.
- All
- Double Top
- Flag
- Head and Shoulders
- Pennant
- Rectangle
- Triangle
- Triple top
- All
- #AAPL
- #AMZN
- #Bitcoin
- #EBAY
- #FB
- #GOOG
- #INTC
- #KO
- #MA
- #MCD
- #MSFT
- #NTDOY
- #PEP
- #TSLA
- #TWTR
- AUDCAD
- AUDCHF
- AUDJPY
- AUDUSD
- EURCAD
- EURCHF
- EURGBP
- EURJPY
- EURNZD
- EURRUB
- EURUSD
- GBPAUD
- GBPCHF
- GBPJPY
- GBPUSD
- GOLD
- NZDCAD
- NZDCHF
- NZDJPY
- NZDUSD
- SILVER
- USDCAD
- USDCHF
- USDJPY
- USDRUB
- All
- M5
- M15
- M30
- H1
- D1
- All
- Buy
- Sale
- All
- 1
- 2
- 3
- 4
- 5
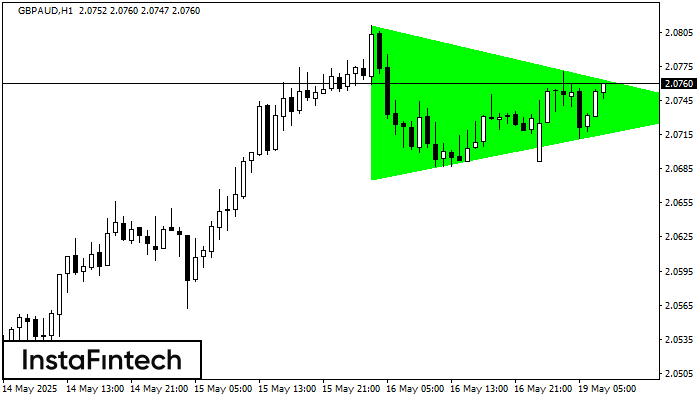
According to the chart of H1, GBPAUD formed the Bullish Symmetrical Triangle pattern. The lower border of the pattern touches the coordinates 2.0676/2.0737 whereas the upper border goes across 2.0811/2.0737
Open chart in a new window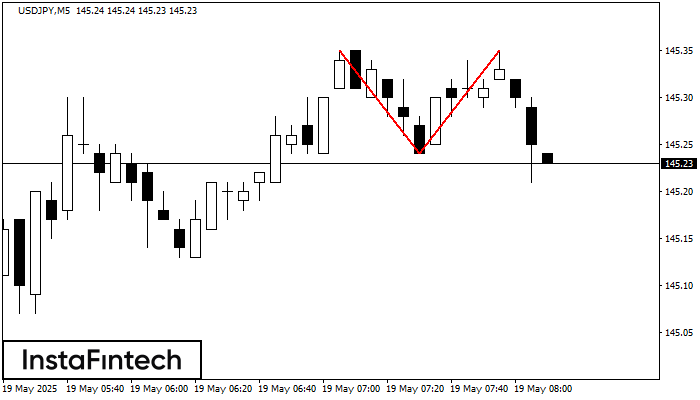
The Double Top pattern has been formed on USDJPY M5. It signals that the trend has been changed from upwards to downwards. Probably, if the base of the pattern 145.24
The M5 and M15 time frames may have more false entry points.
Open chart in a new window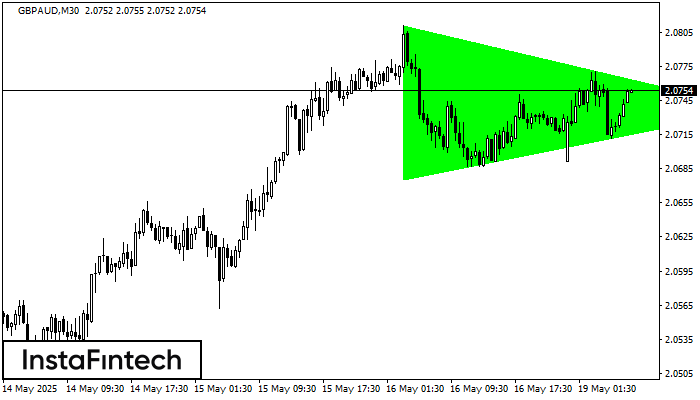
According to the chart of M30, GBPAUD formed the Bullish Symmetrical Triangle pattern. Description: This is the pattern of a trend continuation. 2.0811 and 2.0676 are the coordinates
Open chart in a new window


