


signal strength 2 of 5
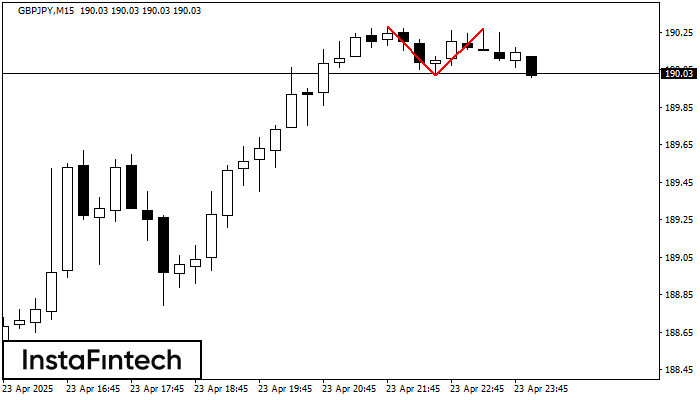
The Double Top reversal pattern has been formed on GBPJPY M15. Characteristics: the upper boundary 190.28; the lower boundary 190.02; the width of the pattern is 25 points. Sell trades are better to be opened below the lower boundary 190.02 with a possible movements towards the 189.79 level.
The M5 and M15 time frames may have more false entry points.
انظر أيضا
- All
- Double Top
- Flag
- Head and Shoulders
- Pennant
- Rectangle
- Triangle
- Triple top
- All
- #AAPL
- #AMZN
- #Bitcoin
- #EBAY
- #FB
- #GOOG
- #INTC
- #KO
- #MA
- #MCD
- #MSFT
- #NTDOY
- #PEP
- #TSLA
- #TWTR
- AUDCAD
- AUDCHF
- AUDJPY
- AUDUSD
- EURCAD
- EURCHF
- EURGBP
- EURJPY
- EURNZD
- EURRUB
- EURUSD
- GBPAUD
- GBPCHF
- GBPJPY
- GBPUSD
- GOLD
- NZDCAD
- NZDCHF
- NZDJPY
- NZDUSD
- SILVER
- USDCAD
- USDCHF
- USDJPY
- USDRUB
- All
- M5
- M15
- M30
- H1
- D1
- All
- Buy
- Sale
- All
- 1
- 2
- 3
- 4
- 5
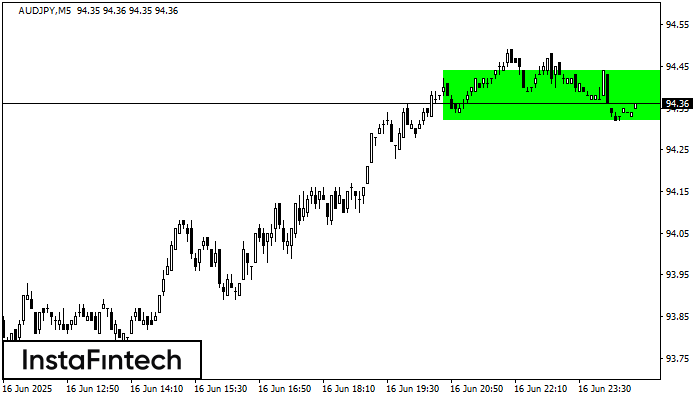
According to the chart of M5, AUDJPY formed the Bullish Rectangle. This type of a pattern indicates a trend continuation. It consists of two levels: resistance 94.44 and support 94.32
The M5 and M15 time frames may have more false entry points.
Open chart in a new window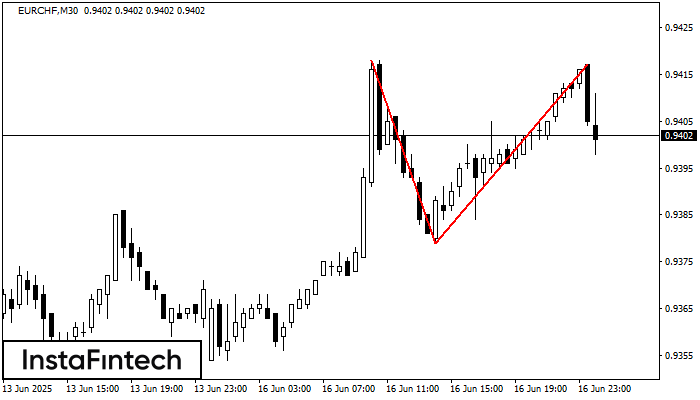
On the chart of EURCHF M30 the Double Top reversal pattern has been formed. Characteristics: the upper boundary 0.9417; the lower boundary 0.9379; the width of the pattern 38 points
Open chart in a new window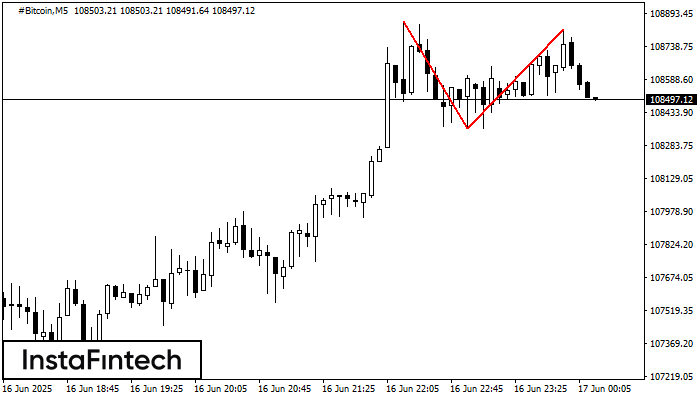
The Double Top pattern has been formed on #Bitcoin M5. It signals that the trend has been changed from upwards to downwards. Probably, if the base of the pattern 108359.72
The M5 and M15 time frames may have more false entry points.
Open chart in a new window


