


signal strength 2 of 5

The Bearish pennant pattern has formed on the #AAPL M15 chart. It signals potential continuation of the existing trend. Specifications: the pattern’s bottom has the coordinate of 216.06; the projection of the flagpole height is equal to 323 pips. In case the price breaks out the pattern’s bottom of 216.06, the downtrend is expected to continue for further level 215.84.
The M5 and M15 time frames may have more false entry points.
- All
- Double Top
- Flag
- Head and Shoulders
- Pennant
- Rectangle
- Triangle
- Triple top
- All
- #AAPL
- #AMZN
- #Bitcoin
- #EBAY
- #FB
- #GOOG
- #INTC
- #KO
- #MA
- #MCD
- #MSFT
- #NTDOY
- #PEP
- #TSLA
- #TWTR
- AUDCAD
- AUDCHF
- AUDJPY
- AUDUSD
- EURCAD
- EURCHF
- EURGBP
- EURJPY
- EURNZD
- EURRUB
- EURUSD
- GBPAUD
- GBPCHF
- GBPJPY
- GBPUSD
- GOLD
- NZDCAD
- NZDCHF
- NZDJPY
- NZDUSD
- SILVER
- USDCAD
- USDCHF
- USDJPY
- USDRUB
- All
- M5
- M15
- M30
- H1
- D1
- All
- Buy
- Sale
- All
- 1
- 2
- 3
- 4
- 5
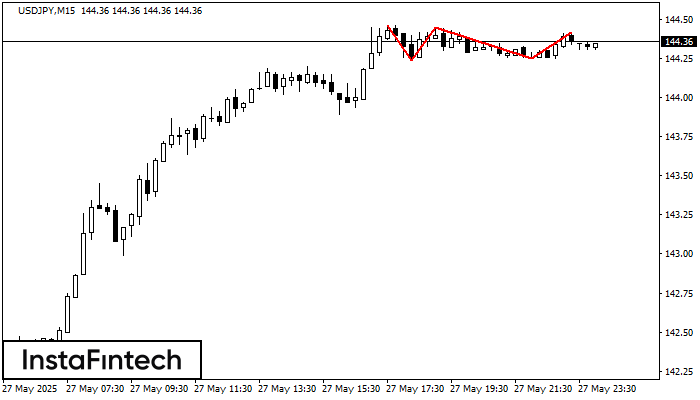
M15 চার্টে, USDJPY ট্রেডিং ইন্সট্রুমেন্টের ট্রিপল টপ প্যাটার্ন গঠিত হয়েছে। এটি একটি রিভার্সাল বা বিপরীতমুখী প্যাটার্ন যা নিম্নলিখিত বৈশিষ্ট্যগুলিকে সমন্বিত করে: রেজিস্ট্যান্স স্তর 4, সাপোর্ট স্তর -1 এবং প্যাটার্নের প্রস্থ
M5 এবং M15 টাইম ফ্রেমে আরও ভুল এন্ট্রি পয়েন্ট থাকতে পারে।
Open chart in a new window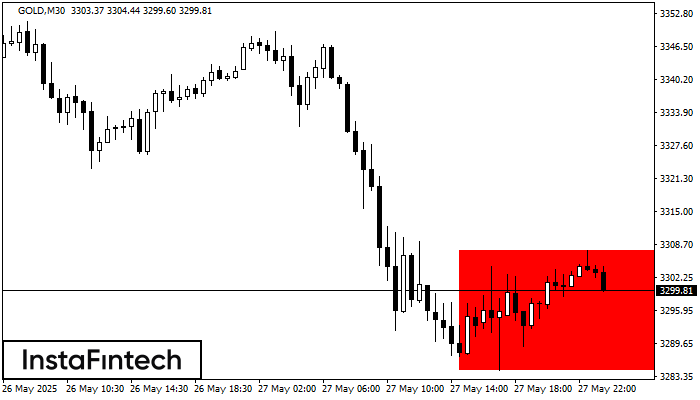
M30 চার্ট অনুসারে, GOLD বিয়ারিশ রেক্ট্যাঙ্গেল গঠন করেছে যা চলমান প্রবণতার ধারাবাহিকতার প্যাটার্ন। প্যাটার্নটি নিম্নলিখিত সীমানার মধ্যে রয়েছে: নীচের সীমানা 3284.62 – 3284.62 এবং উপরের সীমানা 3307.50 – 3307.50৷ নীচের
Open chart in a new window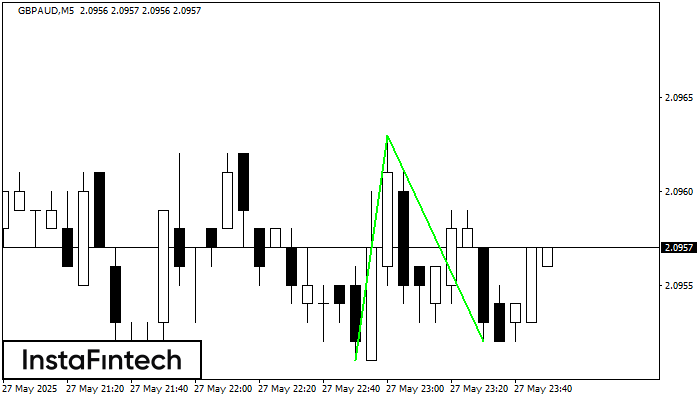
M5 চার্টে, GBPAUD-এর ডাবল বটম প্যাটার্নটি গঠিত হয়েছে। উপরের সীমানা হল 2.0963; নীচের সীমানা হল 2.0952। প্যাটার্নের প্রস্থ হল 12 পয়েন্ট। 2.0963-এর উপরের সীমানা ভেদ করার ক্ষেত্রে, প্রবণতা পরিবর্তনের পূর্বাভাস
M5 এবং M15 টাইম ফ্রেমে আরও ভুল এন্ট্রি পয়েন্ট থাকতে পারে।
Open chart in a new window


