empty
was formed on 04.04 at 16:11:55 (UTC+0)
signal strength 1 of 5
Bearish pennant #MA M5

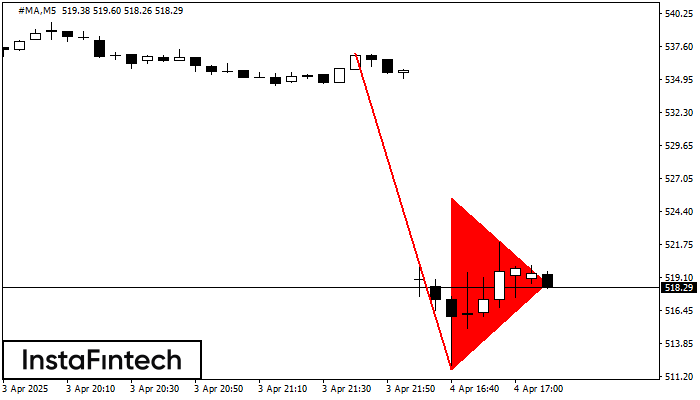
The Bearish pennant pattern has formed on the #MA M5 chart. This pattern type is characterized by a slight slowdown after which the price will move in the direction of the original trend. In case the price fixes below the pattern’s low of 511.79, a trader will be able to successfully enter the sell position.

The M5 and M15 time frames may have more false entry points.

আরও দেখুন

Figure
  • All
  • Double Top
  • Flag
  • Head and Shoulders
  • Pennant
  • Rectangle
  • Triangle
  • Triple top
Instrument
  • All
  • #AAPL
  • #AMZN
  • #Bitcoin
  • #EBAY
  • #FB
  • #GOOG
  • #INTC
  • #KO
  • #MA
  • #MCD
  • #MSFT
  • #NTDOY
  • #PEP
  • #TSLA
  • #TWTR
  • AUDCAD
  • AUDCHF
  • AUDJPY
  • AUDUSD
  • EURCAD
  • EURCHF
  • EURGBP
  • EURJPY
  • EURNZD
  • EURRUB
  • EURUSD
  • GBPAUD
  • GBPCHF
  • GBPJPY
  • GBPUSD
  • GOLD
  • NZDCAD
  • NZDCHF
  • NZDJPY
  • NZDUSD
  • SILVER
  • USDCAD
  • USDCHF
  • USDJPY
  • USDRUB
Timeframe
  • All
  • M5
  • M15
  • M30
  • H1
  • D1
Trend
  • All
  • Buy
  • Sale
Signal Strength
  • All
  • 1
  • 2
  • 3
  • 4
  • 5
Head and Shoulders
was formed on 14.05 at 08:30:22 (UTC+0)
signal strength 3 of 5
Head and Shoulders AUDUSD M30

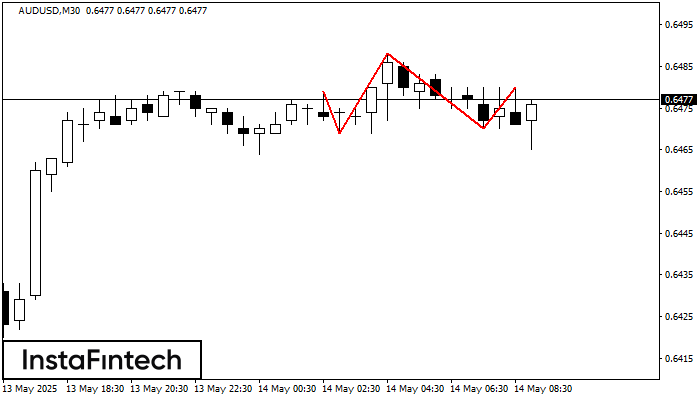
According to the chart of M30, AUDUSD formed the Head and Shoulders pattern. The Head’s top is set at 0.6488 while the median line of the Neck is found

Open chart in a new window
Head and Shoulders
was formed on 14.05 at 08:15:39 (UTC+0)
signal strength 2 of 5
Head and Shoulders AUDUSD M15

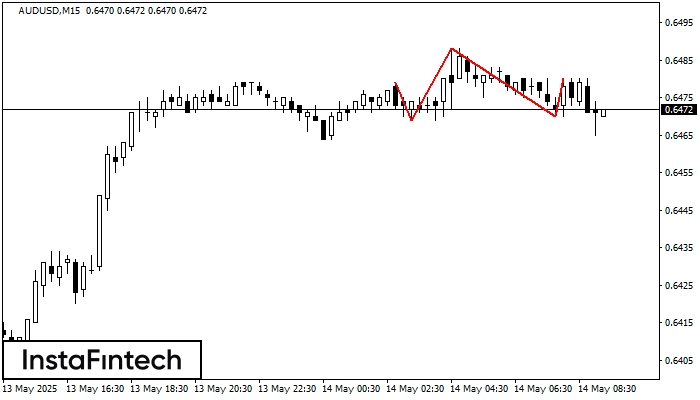
The technical pattern called Head and Shoulders has appeared on the chart of AUDUSD M15. There are weighty reasons to suggest that the price will surpass the Neckline 0.6469/0.6470 after

The M5 and M15 time frames may have more false entry points.

Open chart in a new window
Bullish Rectangle
was formed on 14.05 at 07:47:39 (UTC+0)
signal strength 3 of 5
Bullish Rectangle AUDCAD M30

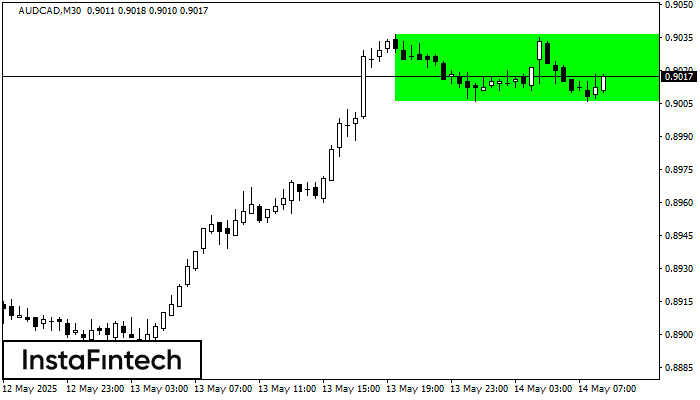
According to the chart of M30, AUDCAD formed the Bullish Rectangle. This type of a pattern indicates a trend continuation. It consists of two levels: resistance 0.9036 and support 0.9006

Open chart in a new window
এখন কথা বলতে পারবেন না?
আপনার প্রশ্ন জিজ্ঞাসা করুন চ্যাট.
Widget callback
 

Dear visitor,

Your IP address shows that you are currently located in the USA. If you are a resident of the United States, you are prohibited from using the services of InstaFintech Group including online trading, online transfers, deposit/withdrawal of funds, etc.

If you think you are seeing this message by mistake and your location is not the US, kindly proceed to the website. Otherwise, you must leave the website in order to comply with government restrictions.

Why does your IP address show your location as the USA?

  • - you are using a VPN provided by a hosting company based in the United States;
  • - your IP does not have proper WHOIS records;
  • - an error occurred in the WHOIS geolocation database.

Please confirm whether you are a US resident or not by clicking the relevant button below. If you choose the wrong option, being a US resident, you will not be able to open an account with InstaForex anyway.

We are sorry for any inconvenience caused by this message.