empty
21.03.2025 10:21 AM
Federal Reserve throws lifebuoy to stock market

This image is no longer relevant

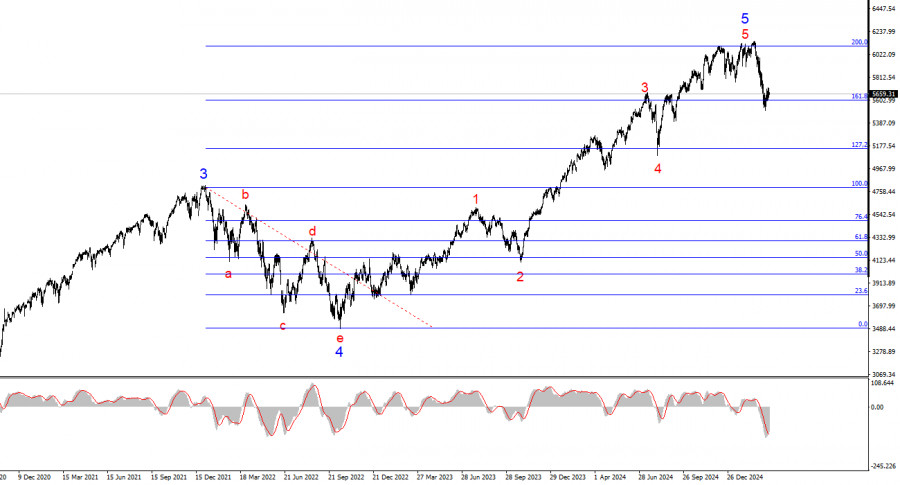
The wave structure on the 24-hour chart for #SPX is fairly clear. The first and most important point is the large-scale five-wave structure, which is so wide that it barely fits in the platform screen even at the smallest scale. In simpler terms, US stock indices have been in a long-term uptrend. But as we know, trends eventually reverse.

At this point, wave 5 of 5 appears to be complete, with the instrument making four failed attempts to break above 6,093, which corresponds to a 200.0% Fibonacci extension from wave 4. In my view, a corrective wave sequence is now unfolding. The US stock market is overheated, and more experts are warning of a "bubble."

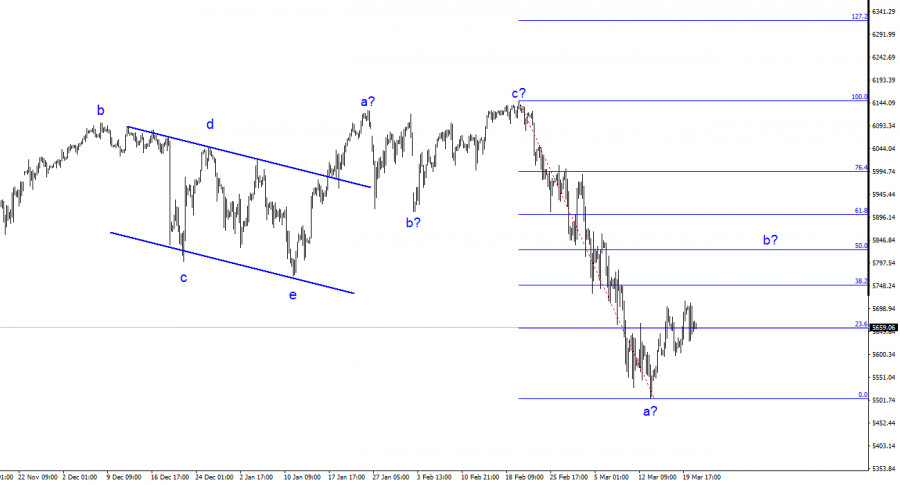
On the 4-hour chart, we see a completed complex corrective structure a-b-c-d-e, followed by an upward a-b-c pattern. This suggests that a new downward structure is now in progress, and its first wave closely resembles an impulse.

Hence, I expect an upward wave 2 or b, after which the decline is likely to resume. My current outlook is based on the daily wave count, which implies a prolonged downward movement for the S&P 500.

The Federal Reserve calms market panic, but risks remain

As I previously warned, #SPX has started forming corrective wave b, which could lift the index as high as 5,825—50.0% Fibonacci retracement of wave a. This suggests that while the US stock market may rise in the short term, it will likely be a corrective bounce before the next leg down. Of course, wave structures can evolve in many ways—the retracement could just as easily be 38.2% or even 76.4%, but we do have a baseline scenario for now.

At this week's FOMC meeting, it became clear that only the markets are panicking about Trump's tariffs—not the Federal Reserve. The Fed didn't see any significant negative changes in the economy. The regulator expects inflation to accelerate and GDP growth to lose momentum. Hence, monetary policy will likely be eased slowly, just as previously expected.

However, let me remind you that the market has already priced in the Fed's dovish stance. What matters now is the real state of the US economy and its outlook, which remains cautiously negative. Still, the Fed managed to calm the markets somewhat, though we can't ignore the obvious— the US economy is slowing down. Probably not as fast as markets fear, but slowing nonetheless. Therefore, my wave scenario remains valid.

This image is no longer relevant

Final thoughts

Based on the current wave analysis of #SPX, I conclude that the instrument has completed its upward trend phase. In the current environment, I recommend watching 6,125 and Trump's economic policies. His actions—trade wars, tariffs, and import restrictions—pose risks to the stability of the US economy and corporate earnings, making a new downtrend increasingly likely.

The "bubble" in US stock markets appears fully inflated. The 4-hour chart allows for one more upward wave, followed by a bearish move. The 24-hour chart confirms the start of a larger downtrend. On the higher timeframe, the wave picture is even clearer: a clean five-wave structure, with another five-wave pattern inside the fifth wave—a classic indicator that we may be nearing the end. This all points to a lengthy and complex correction, which may have already begun.

Key principles of my analysis:

  • Wave structures should be simple and clear. Complex patterns are difficult to trade and often change.
  • If you are uncertain about the market trend, it's better to stay out.
  • There is no 100% certainty in price direction. Always use Stop Loss orders to protect your positions.
  • Wave analysis can be combined with other analytical methods and trading strategies for a more comprehensive approach.
Chin Zhao,
Analytical expert of InstaForex
© 2007-2025
Select timeframe
5
min
15
min
30
min
1
hour
4
hours
1
day
1
week
Earn on cryptocurrency rate changes with InstaForex
Download MetaTrader 4 and open your first trade
  • Grand Choice
    Contest by
    InstaForex
    InstaForex always strives to help you
    fulfill your biggest dreams.
    JOIN CONTEST

Recommended Stories

US stock market on April 11: S&P 500 and Nasdaq plunge

US equity markets ended Thursday's regular session with steep losses. The S&P 500 dropped 3.46%, the Nasdaq 100 fell 4.31%, and the Dow Jones Industrial Average declined 2.50%

Jakub Novak 13:41 2025-04-11 UTC+2

Update on US stock market on April 11. Major pullback after strong rally. Market regains consciousness.

S&P500 Snapshot of the US benchmark stock indices on Thursday: * Dow -2.5%, * NASDAQ -4.3%, * S&P 500 -3.5% The S&P 500 closed at 5,268, within the range

Jozef Kovach 12:00 2025-04-11 UTC+2

Stocks skyrocket after Trump's tariff delay

The US stock market just experienced one of the most powerful waves of optimism in recent years. On Wednesday, following a statement from President Donald Trump, major stock indices posted

Anna Zotova 15:10 2025-04-10 UTC+2

US market rebounds strongly, but Trump's trade war with China remains unresolved

S&P 500 Overview for April 10 US market rebounds strongly, but Trump's trade war with China remains unresolved Major US indices on Wednesday: Dow +8%, NASDAQ +12%, S&P 500 +9.5%

Jozef Kovach 11:45 2025-04-10 UTC+2

Update on US stock market on April 10. SP500 and NASDAQ grow like mad

At the close of yesterday's regular trading session, US stock indices ended with solid gains. The S&P 500 jumped by 9.52%, while the Nasdaq 100 surged by 12.15%. The industrial

Jakub Novak 11:31 2025-04-10 UTC+2

US and China engaged in fierce battle: markets slump, high-tech stocks bruised, gold stands tall

Global markets are once again in turmoil: the escalation of the trade war between the US and China has slammed stock markets, gold is breaking records, Meta is mired

Аlena Ivannitskaya 15:56 2025-04-09 UTC+2

US markets attempt to stabilize at key support levels

S&P 500 The market tries to hold support Main US indices on Tuesday: Dow -0.8%, NASDAQ -2.2%, S&P 500 -1.6%, S&P 500 at 4983, range 4800–5700. It was another volatile

Jozef Kovach 10:44 2025-04-09 UTC+2

Stock Market Overview for April 9: S&P 500 and NASDAQ Return to Annual Lows

Following Tuesday's regular trading session, U.S. stock indices closed with another decline, ending just a step away from their annual lows. The S&P 500 dropped by 1.57%, the Nasdaq

Jakub Novak 09:22 2025-04-09 UTC+2

US market: real reason behind Trump's tariffs revealed. Part 1

S&P 500 Overview for April 8 US market: real reason behind Trump's tariffs revealed. Part 1 Major US indices on Monday: Dow -0.9%, NASDAQ +0.1%, S&P 500 -0.2%, S&P

Jozef Kovach 13:50 2025-04-08 UTC+2

US market sees sharp rebound. Part 2

S&P 500 Overview for April 8 US market sees sharp rebound. Part 2 Major US indices on Monday: Dow -0.9%, NASDAQ +0.1%, S&P 500 -0.2%, S&P 500: 5,062, trading range

Jozef Kovach 13:04 2025-04-08 UTC+2
Can't speak right now?
Ask your question in the chat.
Widget callback
 

Dear visitor,

Your IP address shows that you are currently located in the USA. If you are a resident of the United States, you are prohibited from using the services of InstaFintech Group including online trading, online transfers, deposit/withdrawal of funds, etc.

If you think you are seeing this message by mistake and your location is not the US, kindly proceed to the website. Otherwise, you must leave the website in order to comply with government restrictions.

Why does your IP address show your location as the USA?

  • - you are using a VPN provided by a hosting company based in the United States;
  • - your IP does not have proper WHOIS records;
  • - an error occurred in the WHOIS geolocation database.

Please confirm whether you are a US resident or not by clicking the relevant button below. If you choose the wrong option, being a US resident, you will not be able to open an account with InstaForex anyway.

We are sorry for any inconvenience caused by this message.