EUR/USD 5-Minute Analysis
The EUR/USD currency pair traded on Wednesday as it did on Monday and Tuesday. For most of the day, we observed low-volatility, erratic movements with no clear logic. No information on tariffs was released by Donald Trump on Wednesday, so any analysis of the U.S. President's trade-related announcements will need to be conducted today. The ADP employment report was published only during the U.S. trading session, which turned out to be nearly twice as strong as forecasted—yet it still failed to support the dollar. As we warned yesterday, this report is secondary. Even if not entirely secondary, the market places much more weight on the Nonfarm Payrolls report when assessing the state of the U.S. labor market.
Thus, nothing interesting, logical, or consistent was observed on Wednesday. A week that initially seemed full of potential for significant market moves turned out to be dull. The market continues to ignore most macroeconomic reports and is even reacting rather indifferently to new statements from Donald Trump.
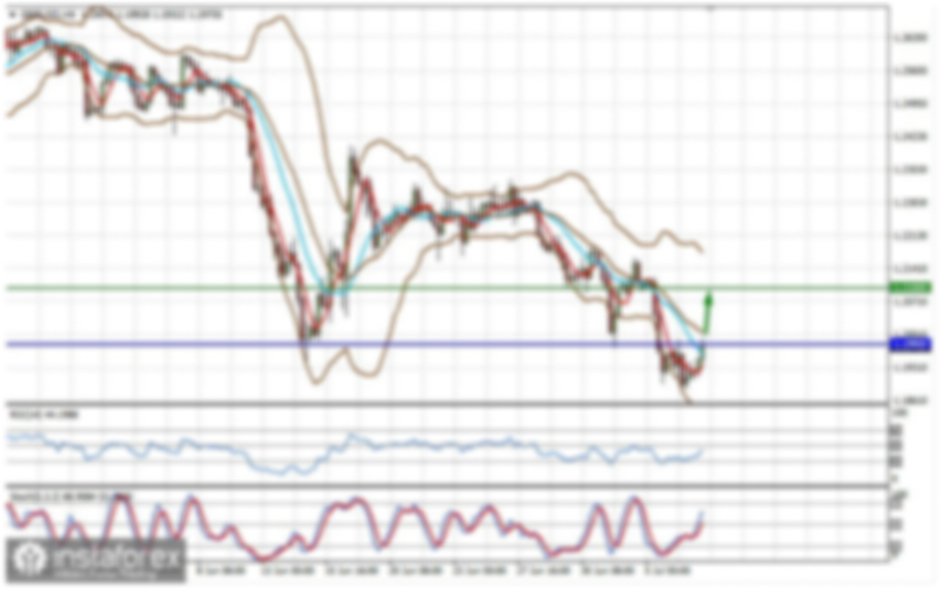
Based on Wednesday's trading signals, we can emphasize two rebounds from the critical line. However, these rebounds were not very precise. Nevertheless, long positions could be opened based on them—even though the dollar's decline contradicted the macroeconomic backdrop. During the U.S. session, the dollar faced renewed pressure, allowing the price to reach the Senkou Span B line by day's end. As a result, the single long position could yield about 50–60 pips in profit.
COT Report
The latest COT report is dated March 25. The illustration above clearly shows that the net position of non-commercial traders had remained bullish for a long time. Bears struggled to gain dominance, but now the bulls have retaken the initiative. The bears' advantage has faded since Trump became President, and the dollar started plummeting. We cannot say with certainty that the decline of the U.S. currency will continue, as COT reports reflect the sentiment of large players—which, under current circumstances, can change rapidly.
We still see no fundamental factors supporting the strengthening of the euro, but one very significant factor has emerged for the weakening of the dollar. The pair may continue to correct for several more weeks or months, but a 16-year downward trend will not be reversed so quickly.
The red and blue lines have crossed again, indicating that the market trend is now "bullish." During the last reporting week, the number of long positions in the "Non-commercial" group increased by 800, while the number of short positions decreased by 5,200. Accordingly, the net position increased by another 44,400 thousand contracts.
EUR/USD 1-Hour Analysis
On the hourly chart, the downward movement of the EUR/USD pair ended quickly as Trump announced new tariffs. We still believe that a decline will resume in the medium term due to the divergence in monetary policy between the ECB and the Fed. However, it's unclear how long the market will continue reacting solely to the "Trump factor." Traders are ignoring many reports and news events, the dollar is being sold off at every opportunity, and even when conditions favor it, the greenback struggles to gain. In recent weeks, volatility has also dropped, and price movements have become increasingly erratic.
For April 3, we identify the following trading levels: 1.0340–1.0366, 1.0461, 1.0524, 1.0585, 1.0658–1.0669, 1.0757, 1.0797, 1.0823, 1.0886, 1.0949, 1.1006, 1.1092, along with the Senkou Span B line (1.0868) and the Kijun-sen line (1.0791). Remember that Ichimoku indicator lines can shift throughout the day, so this should be considered when identifying trading signals. Don't forget to move your Stop Loss to breakeven once the price moves 15 pips in the right direction—this will protect against potential losses if the signal turns out to be false.
On Thursday, service sector PMIs will be released in Germany, the Eurozone, and the U.S. However, we strongly doubt that the market will react to these indices. Traders are largely ignoring macroeconomic data, and the focus remains on Donald Trump's anticipated announcement of new tariffs—not business activity. A relatively strong reaction is only likely for the ISM Services Index from the U.S.
Illustration Explanations:
- Support and Resistance Levels (thick red lines): Thick red lines indicate where movement may come to an end. Please note that these lines are not sources of trading signals.
- Kijun-sen and Senkou Span B Lines: Ichimoku indicator lines transferred from the 4-hour timeframe to the hourly timeframe. These are strong lines.
- Extreme Levels (thin red lines): Thin red lines where the price has previously bounced. These serve as sources of trading signals.
- Yellow Lines: Trendlines, trend channels, or any other technical patterns.
- Indicator 1 on COT Charts: Represents the net position size for each category of traders.