


signal strength 1 of 5
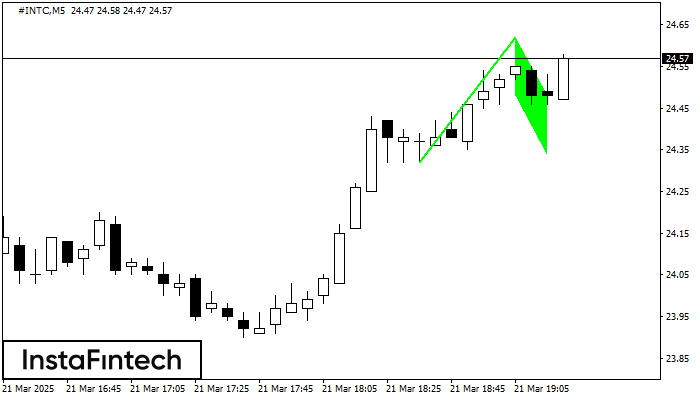
The Bullish Flag pattern has been formed on the chart #INTC M5 which signals that the upward trend will continue. Signals: а break of the peak at 24.62 may push the price higher, and the rise will be the projection of the pole.
The M5 and M15 time frames may have more false entry points.
- All
- Double Top
- Flag
- Head and Shoulders
- Pennant
- Rectangle
- Triangle
- Triple top
- All
- #AAPL
- #AMZN
- #Bitcoin
- #EBAY
- #FB
- #GOOG
- #INTC
- #KO
- #MA
- #MCD
- #MSFT
- #NTDOY
- #PEP
- #TSLA
- #TWTR
- AUDCAD
- AUDCHF
- AUDJPY
- AUDUSD
- EURCAD
- EURCHF
- EURGBP
- EURJPY
- EURNZD
- EURRUB
- EURUSD
- GBPAUD
- GBPCHF
- GBPJPY
- GBPUSD
- GOLD
- NZDCAD
- NZDCHF
- NZDJPY
- NZDUSD
- SILVER
- USDCAD
- USDCHF
- USDJPY
- USDRUB
- All
- M5
- M15
- M30
- H1
- D1
- All
- Buy
- Sale
- All
- 1
- 2
- 3
- 4
- 5
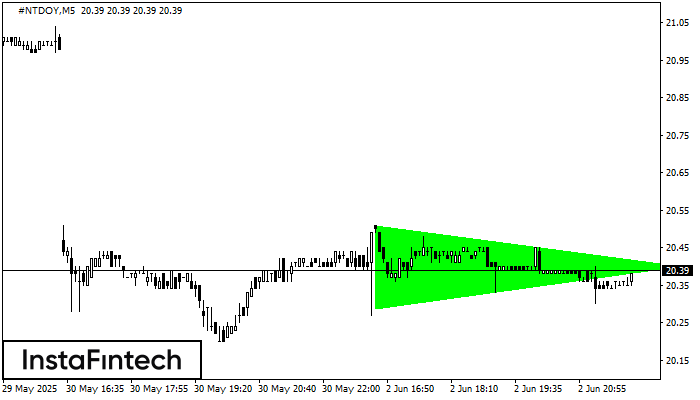
По #NTDOY на M5 сформировалась фигура «Бычий симметричный треугольник», которая сигнализирует нам о продолжении тенденции. Характеристика: Верхняя граница фигуры имеет координаты 20.51/20.40; Нижняя граница 20.29/20.40; Проекция ширины фигуры 22 пунктов
Таймфреймы М5 и М15 могут иметь больше ложных точек входа.
Открыть график инструмента в новом окне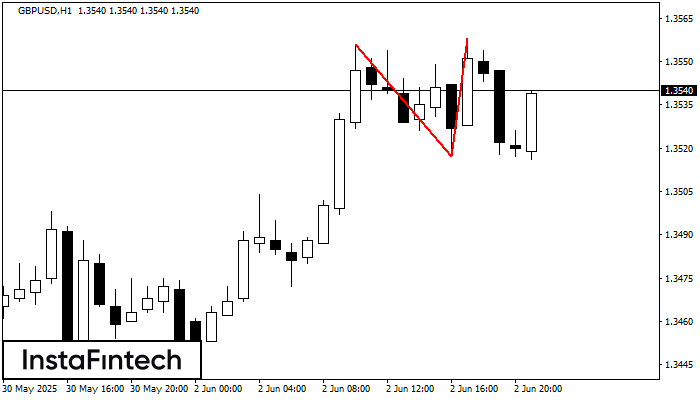
По GBPUSD на H1 сформировалась разворотная фигура «Двойная вершина». Характеристика: Верхняя граница 1.3556; Нижняя граница 1.3517; Ширина фигуры 41 пунктов. Позицию на продажу возможно открыть ниже нижней границы 1.3517
Открыть график инструмента в новом окне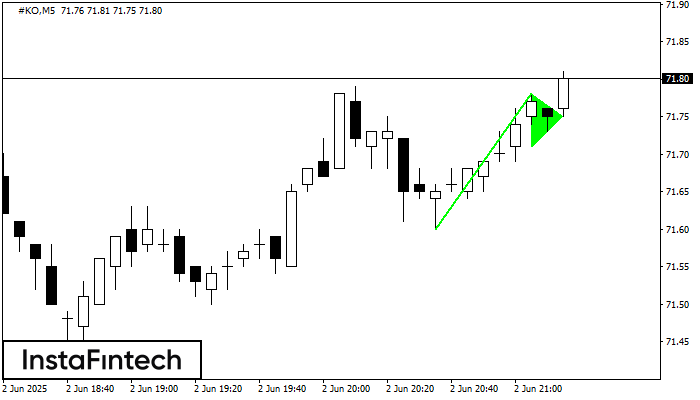
Сигнал «Бычий вымпел» – Торговый инструмент #KO M5, фигура продолжения тенденции. Прогноз: позицию на покупку можно открывать выше максимума фигуры 71.78, где перспектива будущего хода будет являться проекцией высоты флагштока
Таймфреймы М5 и М15 могут иметь больше ложных точек входа.
Открыть график инструмента в новом окне


