

signal strength 1 of 5
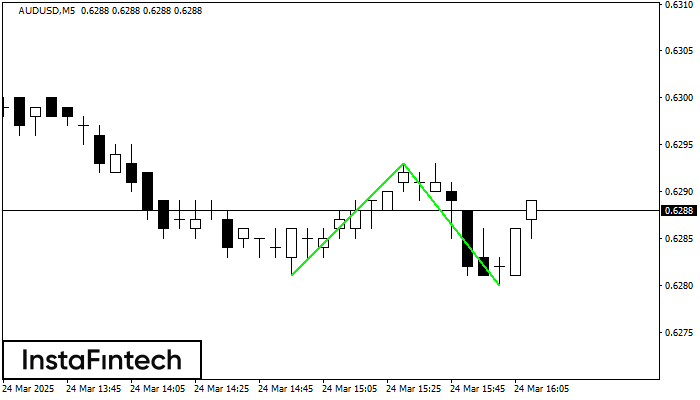
The Double Bottom pattern has been formed on AUDUSD M5; the upper boundary is 0.6293; the lower boundary is 0.6280. The width of the pattern is 12 points. In case of a break of the upper boundary 0.6293, a change in the trend can be predicted where the width of the pattern will coincide with the distance to a possible take profit level.
The M5 and M15 time frames may have more false entry points.
See Also
- All
- Double Top
- Flag
- Head and Shoulders
- Pennant
- Rectangle
- Triangle
- Triple top
- All
- #AAPL
- #AMZN
- #Bitcoin
- #EBAY
- #FB
- #GOOG
- #INTC
- #KO
- #MA
- #MCD
- #MSFT
- #NTDOY
- #PEP
- #TSLA
- #TWTR
- AUDCAD
- AUDCHF
- AUDJPY
- AUDUSD
- EURCAD
- EURCHF
- EURGBP
- EURJPY
- EURNZD
- EURRUB
- EURUSD
- GBPAUD
- GBPCHF
- GBPJPY
- GBPUSD
- GOLD
- NZDCAD
- NZDCHF
- NZDJPY
- NZDUSD
- SILVER
- USDCAD
- USDCHF
- USDJPY
- USDRUB
- All
- M5
- M15
- M30
- H1
- D1
- All
- Buy
- Sale
- All
- 1
- 2
- 3
- 4
- 5
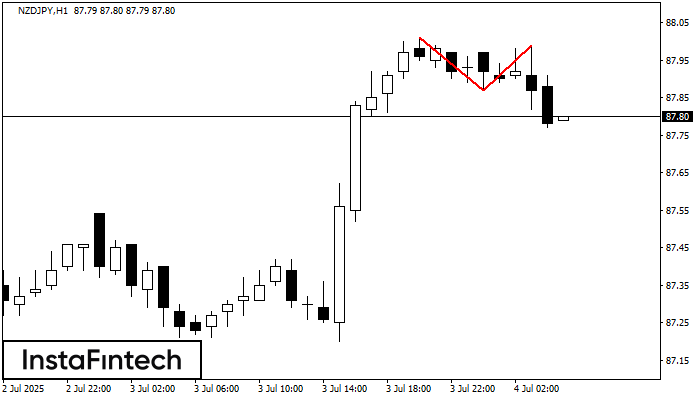
On the chart of NZDJPY H1 the Double Top reversal pattern has been formed. Characteristics: the upper boundary 87.99; the lower boundary 87.87; the width of the pattern 12 points
Open chart in a new window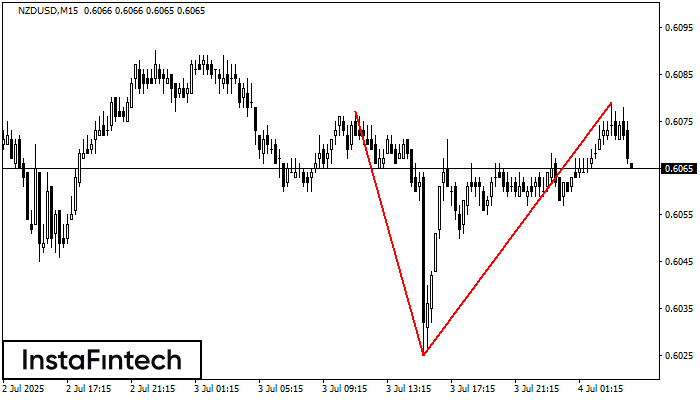
The Double Top pattern has been formed on NZDUSD M15. It signals that the trend has been changed from upwards to downwards. Probably, if the base of the pattern 0.6025
The M5 and M15 time frames may have more false entry points.
Open chart in a new window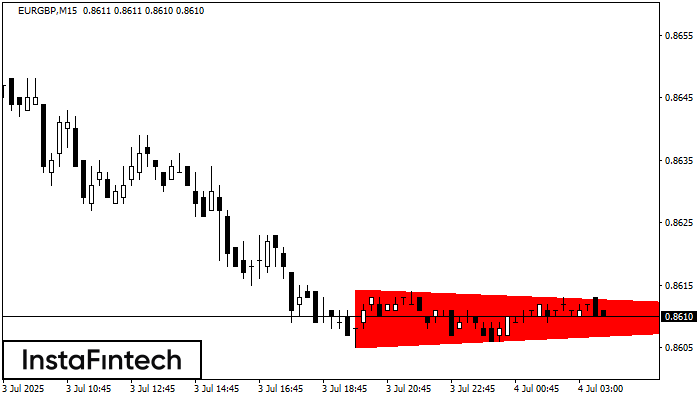
According to the chart of M15, EURGBP formed the Bearish Symmetrical Triangle pattern. Description: The lower border is 0.8605/0.8610 and upper border is 0.8614/0.8610. The pattern width is measured
The M5 and M15 time frames may have more false entry points.
Open chart in a new window


