

signal strength 2 of 5
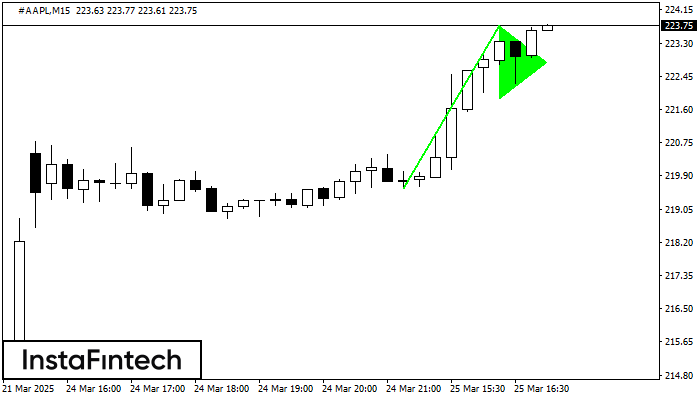
The Bullish pennant graphic pattern has formed on the #AAPL M15 instrument. This pattern type falls under the category of continuation patterns. In this case, if the quote can breaks out high, is expected to continue the upward trend to level 223.96.
The M5 and M15 time frames may have more false entry points.
See Also
- All
- Double Top
- Flag
- Head and Shoulders
- Pennant
- Rectangle
- Triangle
- Triple top
- All
- #AAPL
- #AMZN
- #Bitcoin
- #EBAY
- #FB
- #GOOG
- #INTC
- #KO
- #MA
- #MCD
- #MSFT
- #NTDOY
- #PEP
- #TSLA
- #TWTR
- AUDCAD
- AUDCHF
- AUDJPY
- AUDUSD
- EURCAD
- EURCHF
- EURGBP
- EURJPY
- EURNZD
- EURRUB
- EURUSD
- GBPAUD
- GBPCHF
- GBPJPY
- GBPUSD
- GOLD
- NZDCAD
- NZDCHF
- NZDJPY
- NZDUSD
- SILVER
- USDCAD
- USDCHF
- USDJPY
- USDRUB
- All
- M5
- M15
- M30
- H1
- D1
- All
- Buy
- Sale
- All
- 1
- 2
- 3
- 4
- 5
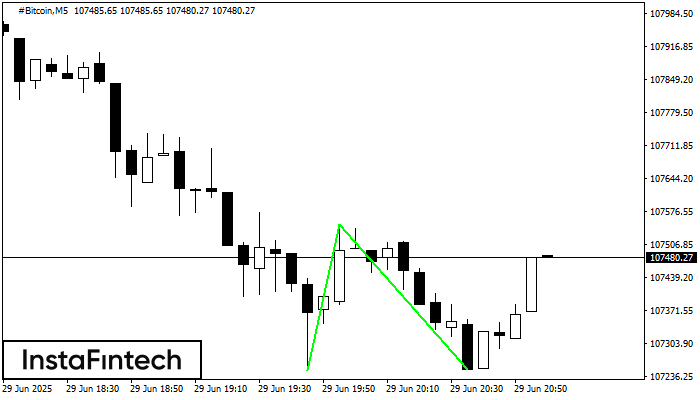
The Double Bottom pattern has been formed on #Bitcoin M5. Characteristics: the support level 107248.11; the resistance level 107549.35; the width of the pattern 30124 points. If the resistance level
The M5 and M15 time frames may have more false entry points.
Open chart in a new window
The Double Top reversal pattern has been formed on #Bitcoin M5. Characteristics: the upper boundary 107140.52; the lower boundary 106768.13; the width of the pattern is 38591 points. Sell trades
The M5 and M15 time frames may have more false entry points.
Open chart in a new window
According to the chart of M5, #Bitcoin formed the Bullish Symmetrical Triangle pattern. The lower border of the pattern touches the coordinates 106253.43/106928.98 whereas the upper border goes across 107645.53/106928.98
The M5 and M15 time frames may have more false entry points.
Open chart in a new window


