

signal strength 1 of 5
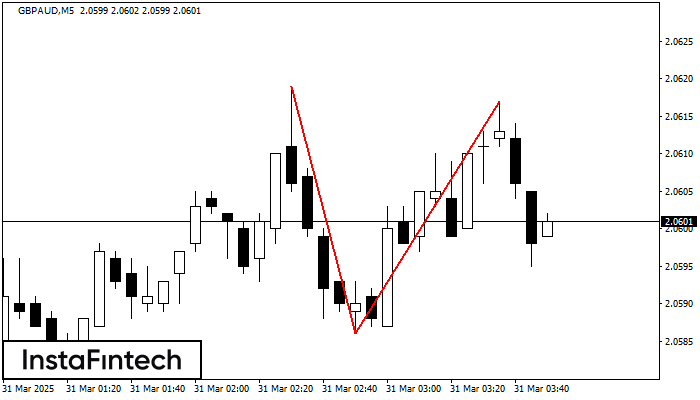
On the chart of GBPAUD M5 the Double Top reversal pattern has been formed. Characteristics: the upper boundary 2.0617; the lower boundary 2.0586; the width of the pattern 31 points. The signal: a break of the lower boundary will cause continuation of the downward trend targeting the 2.0571 level.
The M5 and M15 time frames may have more false entry points.
See Also
- All
- Double Top
- Flag
- Head and Shoulders
- Pennant
- Rectangle
- Triangle
- Triple top
- All
- #AAPL
- #AMZN
- #Bitcoin
- #EBAY
- #FB
- #GOOG
- #INTC
- #KO
- #MA
- #MCD
- #MSFT
- #NTDOY
- #PEP
- #TSLA
- #TWTR
- AUDCAD
- AUDCHF
- AUDJPY
- AUDUSD
- EURCAD
- EURCHF
- EURGBP
- EURJPY
- EURNZD
- EURRUB
- EURUSD
- GBPAUD
- GBPCHF
- GBPJPY
- GBPUSD
- GOLD
- NZDCAD
- NZDCHF
- NZDJPY
- NZDUSD
- SILVER
- USDCAD
- USDCHF
- USDJPY
- USDRUB
- All
- M5
- M15
- M30
- H1
- D1
- All
- Buy
- Sale
- All
- 1
- 2
- 3
- 4
- 5
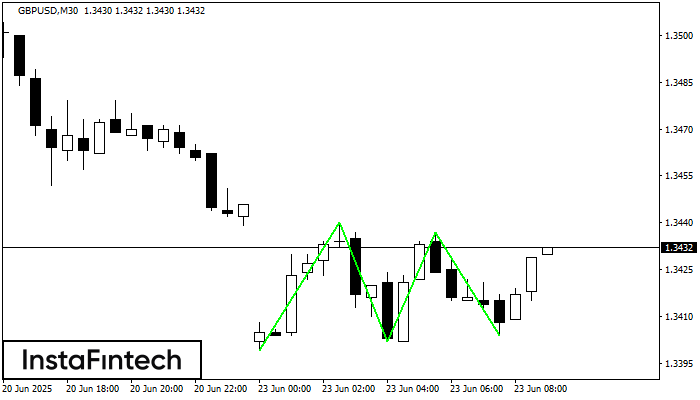
The Triple Bottom pattern has been formed on GBPUSD M30. It has the following characteristics: resistance level 1.3440/1.3437; support level 1.3399/1.3404; the width is 41 points. In the event
Open chart in a new window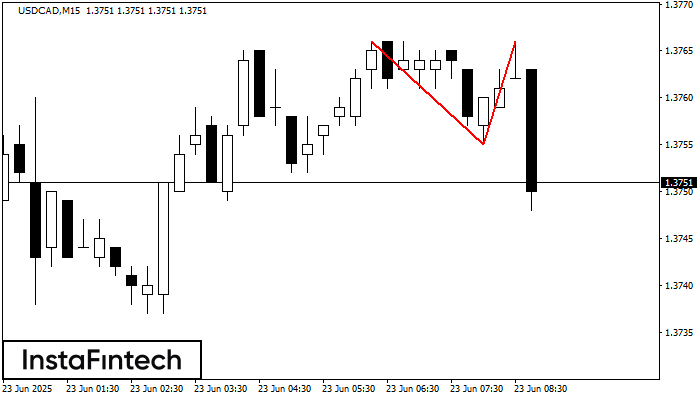
The Double Top pattern has been formed on USDCAD M15. It signals that the trend has been changed from upwards to downwards. Probably, if the base of the pattern 1.3755
The M5 and M15 time frames may have more false entry points.
Open chart in a new window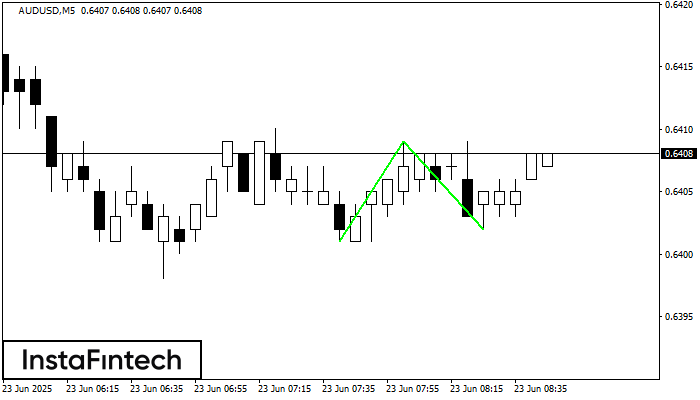
The Double Bottom pattern has been formed on AUDUSD M5. Characteristics: the support level 0.6401; the resistance level 0.6409; the width of the pattern 8 points. If the resistance level
The M5 and M15 time frames may have more false entry points.
Open chart in a new window


