empty
01.02.2022 11:22 AM
Technical analysis for EUR/USD pair on February 2022

Trend analysis

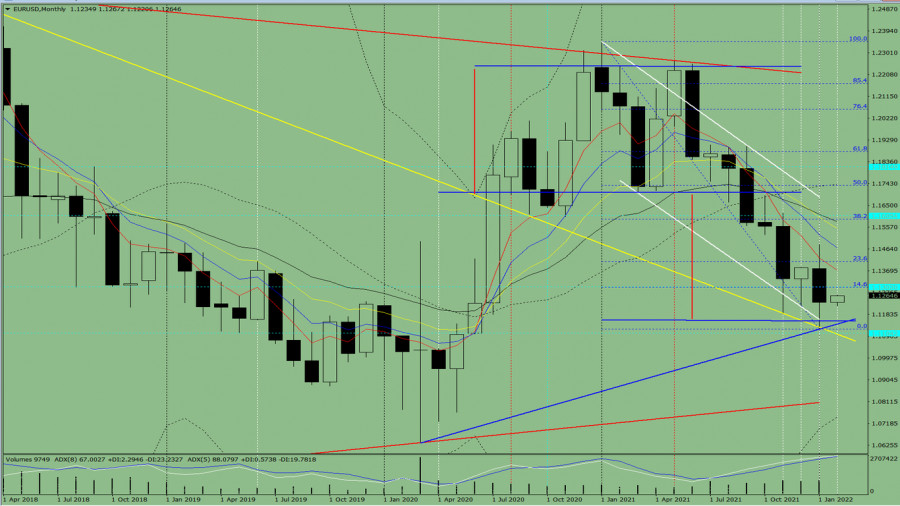
The price from the level of 1.1235 (closing of the January monthly candlestick) will most likely rise to the target of 1.1302 – the historical resistance level (blue dotted line) this month. After this level is reached, it may further increase to the target of 1.1409 – the pullback level of 23.6% (blue dotted line) and continue the upward movement to the target of 1.1590 – the pullback level of 38.2% (blue dotted line).

This image is no longer relevant

Fig. 1 (monthly chart)

Indicator analysis:

  • Indicator analysis - up
  • Fibonacci levels - up
  • Volumes - up
  • Candlestick analysis - up
  • Trend analysis - up
  • Bollinger bands - up

An upward movement can be concluded based on a comprehensive analysis.

The overall result of the candlestick calculation based on the monthly chart: the price will most likely move in an upward trend, both without the first lower shadow (the first week of the month is white) and without the second upper shadow (the last week is white) in the monthly white candlestick.

This month, the price from the level of 1.1235 (closing of the January monthly candlestick) will increase to the target of 1.1302 – the historical resistance level (blue dotted line). After reaching it, it may continue its growth to the target of 1.1409 – the pullback level of 23.6% (blue dotted line), and then further rise to the target of 1.1590 – the pullback level of 38.2% (blue dotted line).

Alternatively, the price from the level of 1.1235 (closing of the January monthly candlestick) may decline to the target of 1.1094 – the support line (thick yellow line). If this line is tested, it may now rise to the target of 1.1302 – the pullback level of 14.6% (blue dotted line) and continue moving up.

Stefan Doll,
Analytical expert of InstaForex
© 2007-2025
Summary
Urgency
Analytic
Sergey Belyaev
Start trade
通过InstaForex赚取加密货币汇率变动的收益。
下载MetaTrader 4并开启您的第一笔交易。
  • Grand Choice
    Contest by
    InstaForex
    InstaForex always strives to help you
    fulfill your biggest dreams.
    JOIN CONTEST

推荐文章

英鎊在2025年7月14日(星期一)仍有可能繼續下滑至其支撐水準。

GBP/USD – 2025年7月14日,星期一 英鎊/美元處於弱勢狀態,其價格走勢低於50日均線,也低於200日均線,RSI(14)指標在空方中立水平(35.32),進一步確認了這一情況。 關鍵水平 1. 阻力位2: 1.3621。

Arief Makmur 07:21 2025-07-14 UTC+2

美國/加拿大(USD/CAD)大宗商品貨幣對今天,2025年7月14日星期一,有可能向其樞軸點修正。

美元/加元,2025年7月14日 儘管加元(Lonnie)目前處於中性至看漲的情況,但美元/加元大宗商品貨幣對今日仍有可能測試樞紐和支撐位。 關鍵水平 1. 阻力位2:1.3768。

Arief Makmur 07:21 2025-07-14 UTC+2

2025年7月14日歐元/美元預測

週五EUR/USD貨幣對的K線呈現看跌格局,價格整合在日MACD線下方。今天的目標是確保收盤價低於1.1692水平。

Laurie Bailey 05:31 2025-07-14 UTC+2

2025年7月14日 GBP/USD 預測

週五,英鎊下跌超過80個點數,跌破了日均平衡線和關鍵信號水平1.3510。此次下跌的原因是疲弱的GDP和工業生產數據。

Laurie Bailey 05:31 2025-07-14 UTC+2

2025年7月14日澳元/美元匯率預測

在日线图上,AUD/USD 货币对位于 MACD 线 (0.6551) 和本地价格通道的上边界(蓝色,0.6597)之间。突破任一水平线将显示价格意图在所选方向上继续运行。

Laurie Bailey 05:31 2025-07-14 UTC+2

2025年7月11日歐元/美元預測

週四,歐元/美元貨幣對繼續下跌,接近1.1645水準,而交易者對於1.1712的127.2%斐波那契回檔水準幾乎無動於衷。如果從1.1645反彈,將有利於歐元,並可能導致小幅上漲至1.1712。

Samir Klishi 12:44 2025-07-11 UTC+2

2025年7月11日英鎊/美元匯率預測

在小時圖上,週四英鎊/美元匯率從1.3611–1.3633的阻力區反彈後,繼續下跌,指向127.2%的斐波那契水平1.3527。從這一水平反彈將有利於英鎊,並可能推動其上升至1.3611–1.3633水平。

Samir Klishi 12:20 2025-07-11 UTC+2

儘管有修正的可能性,黃金在今天,2025年7月11日星期五,仍有走強的潛力。

XAU/USD,2025年7月11日,星期五。 儘管因受限於阻力位1似乎進行了調整,但XAU/USD的技術和基本面狀況的持續強勁,為其進一步走強提供了機會。

Arief Makmur 08:00 2025-07-11 UTC+2

2025年7月11日EUR/USD匯率預測

在每週圖表上,我們觀察到一系列反轉信號:背離、斐波那契時間區間的趨勢轉變,以及從兩條強勁線交匯處—價格通道邊界和斐波那契射線的價格反彈。 如果本週以當前水準收盤,歐元的長期下行趨勢將會開啟(朝向0.9260)。

Laurie Bailey 06:58 2025-07-11 UTC+2

2025年7月11日英鎊/美元預測

在月線圖上,英鎊/美元在第八條斐波那契時間線後,從全球18年價格通道的上邊界計算的161.8%斐波那契反應水平處出現逆轉。 英鎊面臨著長期下滑的趨勢,令人擔憂的是,這可能會逐步接近對等。

Laurie Bailey 06:46 2025-07-11 UTC+2
现在无法通话?
提出您的问题,用 在线帮助.
Widget callback
 

Dear visitor,

Your IP address shows that you are currently located in the USA. If you are a resident of the United States, you are prohibited from using the services of InstaFintech Group including online trading, online transfers, deposit/withdrawal of funds, etc.

If you think you are seeing this message by mistake and your location is not the US, kindly proceed to the website. Otherwise, you must leave the website in order to comply with government restrictions.

Why does your IP address show your location as the USA?

  • - you are using a VPN provided by a hosting company based in the United States;
  • - your IP does not have proper WHOIS records;
  • - an error occurred in the WHOIS geolocation database.

Please confirm whether you are a US resident or not by clicking the relevant button below. If you choose the wrong option, being a US resident, you will not be able to open an account with InstaForex anyway.

We are sorry for any inconvenience caused by this message.