


signal strength 1 of 5
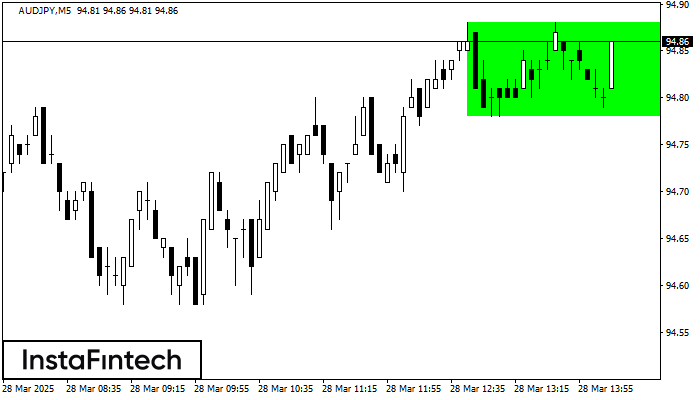
According to the chart of M5, AUDJPY formed the Bullish Rectangle. The pattern indicates a trend continuation. The upper border is 94.88, the lower border is 94.78. The signal means that a long position should be opened above the upper border 94.88 of the Bullish Rectangle.
The M5 and M15 time frames may have more false entry points.
- All
- Double Top
- Flag
- Head and Shoulders
- Pennant
- Rectangle
- Triangle
- Triple top
- All
- #AAPL
- #AMZN
- #Bitcoin
- #EBAY
- #FB
- #GOOG
- #INTC
- #KO
- #MA
- #MCD
- #MSFT
- #NTDOY
- #PEP
- #TSLA
- #TWTR
- AUDCAD
- AUDCHF
- AUDJPY
- AUDUSD
- EURCAD
- EURCHF
- EURGBP
- EURJPY
- EURNZD
- EURRUB
- EURUSD
- GBPAUD
- GBPCHF
- GBPJPY
- GBPUSD
- GOLD
- NZDCAD
- NZDCHF
- NZDJPY
- NZDUSD
- SILVER
- USDCAD
- USDCHF
- USDJPY
- USDRUB
- All
- M5
- M15
- M30
- H1
- D1
- All
- Buy
- Sale
- All
- 1
- 2
- 3
- 4
- 5
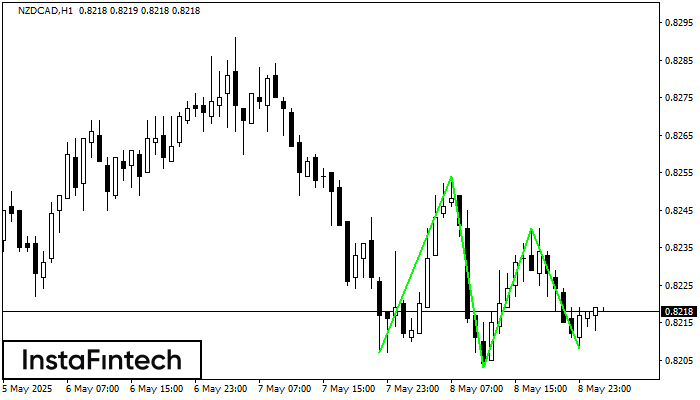
H1 চার্টে NZDCAD-এর ট্রিপল বটম প্যাটার্নটি গঠিত হয়েছে। প্যাটার্নের বৈশিষ্ট্য: প্যাটার্নের নীচের লাইনে কোঅর্ডিনেট 0.8254 রয়েছে এবং এটির উপরের সীমা 0.8254/0.8240, প্রস্থের প্রজেকশন হল 47 পয়েন্ট। ট্রিপল বটম প্যাটার্নের
Open chart in a new window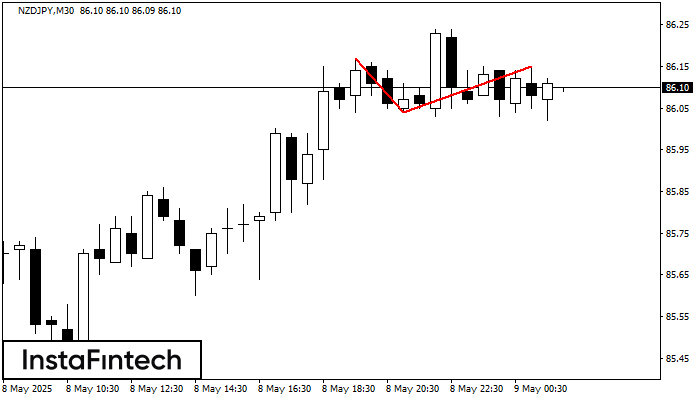
M30 চার্টে, NZDJPY-এর ডাবল টপ রিভার্সাল বা বিপরীতমুখী প্যাটার্ন গঠিত হয়েছে। বৈশিষ্ট্য: উপরের সীমানা 86.17; নীচের সীমানা 86.04; প্যাটার্নের প্রস্থ হল 11 পয়েন্ট। 86.04 85.74 স্তরের দিকে সম্ভাব্য মুভমেন্টের সাথে
Open chart in a new window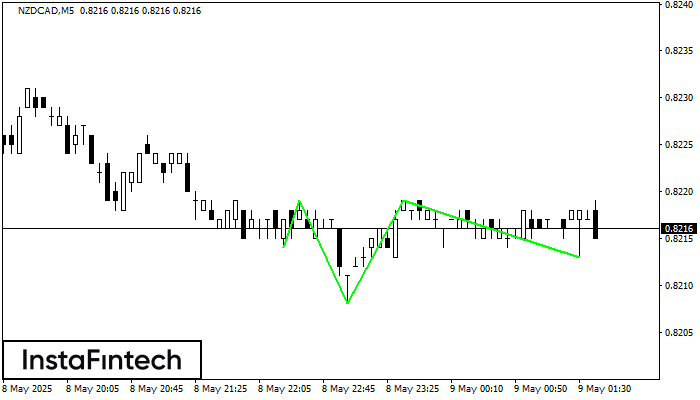
M5 চার্ট অনুযায়ী, NZDCAD-এর ইনভার্স হেড অ্যান্ড শোল্ডার্স প্যাটার্ন গঠিত হয়েছে। হেডের টপ 0.8219 -এ নির্ধারণ করা হয়েছে এবং নেকের মিডিয়ান লাইনটি 0.8208/0.8213-এ পাওয়া গিয়েছে। ইনভার্স হেড অ্যান্ড শোল্ডার্স প্যাটার্নের
M5 এবং M15 টাইম ফ্রেমে আরও ভুল এন্ট্রি পয়েন্ট থাকতে পারে।
Open chart in a new window


