empty
was formed on 04.04 at 09:30:33 (UTC+0)
signal strength 1 of 5
Inverse Head and Shoulder USDJPY M5

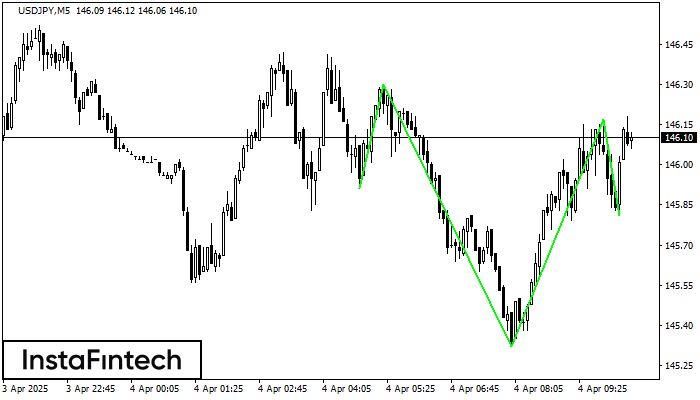
According to M5, USDJPY is shaping the technical pattern – the Inverse Head and Shoulder. In case the Neckline 146.30/146.17 is broken out, the instrument is likely to move toward 146.32.

The M5 and M15 time frames may have more false entry points.

Figure
  • All
  • Double Top
  • Flag
  • Head and Shoulders
  • Pennant
  • Rectangle
  • Triangle
  • Triple top
Instrument
  • All
  • #AAPL
  • #AMZN
  • #Bitcoin
  • #EBAY
  • #FB
  • #GOOG
  • #INTC
  • #KO
  • #MA
  • #MCD
  • #MSFT
  • #NTDOY
  • #PEP
  • #TSLA
  • #TWTR
  • AUDCAD
  • AUDCHF
  • AUDJPY
  • AUDUSD
  • EURCAD
  • EURCHF
  • EURGBP
  • EURJPY
  • EURNZD
  • EURRUB
  • EURUSD
  • GBPAUD
  • GBPCHF
  • GBPJPY
  • GBPUSD
  • GOLD
  • NZDCAD
  • NZDCHF
  • NZDJPY
  • NZDUSD
  • SILVER
  • USDCAD
  • USDCHF
  • USDJPY
  • USDRUB
Timeframe
  • All
  • M5
  • M15
  • M30
  • H1
  • D1
Trend
  • All
  • Buy
  • Sale
Signal Strength
  • All
  • 1
  • 2
  • 3
  • 4
  • 5
Double Top
was formed on 24.04 at 22:45:10 (UTC+0)
signal strength 2 of 5
Double Top #Bitcoin M15

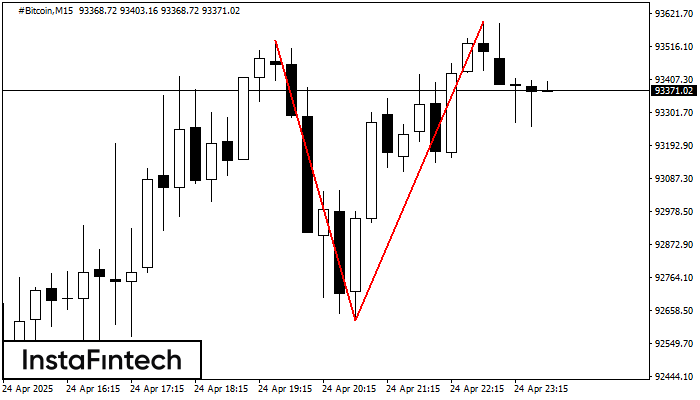
The Double Top pattern has been formed on #Bitcoin M15. It signals that the trend has been changed from upwards to downwards. Probably, if the base of the pattern 92625.25

The M5 and M15 time frames may have more false entry points.

Open chart in a new window
Bullish Symmetrical Triangle
was formed on 24.04 at 22:24:37 (UTC+0)
signal strength 1 of 5
Bullish Symmetrical Triangle EURCAD M5

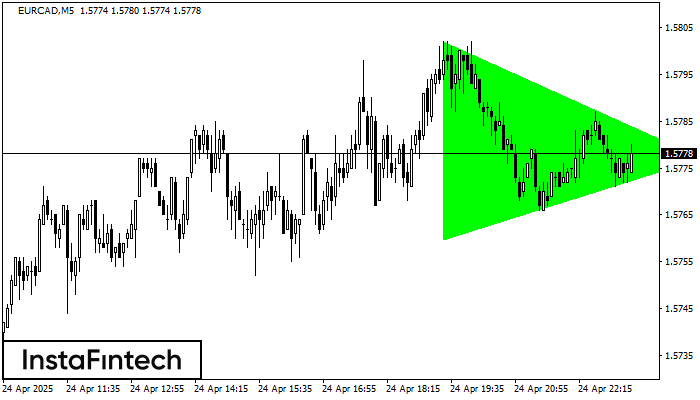
According to the chart of M5, EURCAD formed the Bullish Symmetrical Triangle pattern, which signals the trend will continue. Description. The upper border of the pattern touches the coordinates 1.5802/1.5777

The M5 and M15 time frames may have more false entry points.

Open chart in a new window
Double Bottom
was formed on 24.04 at 21:30:56 (UTC+0)
signal strength 3 of 5
Double Bottom EURGBP M30

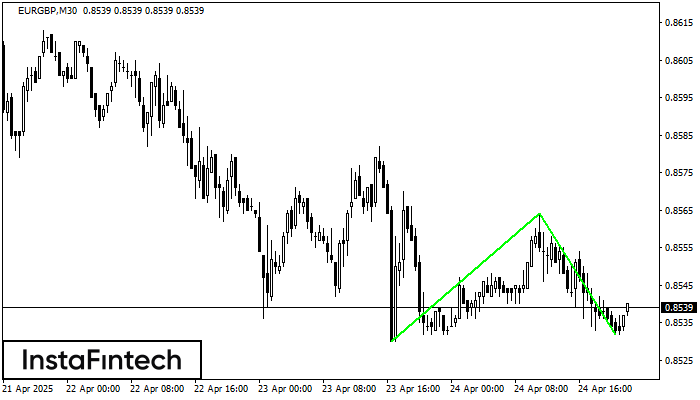
The Double Bottom pattern has been formed on EURGBP M30. This formation signals a reversal of the trend from downwards to upwards. The signal is that a buy trade should

Open chart in a new window
现在无法通话?
提出您的问题,用 在线帮助.
Widget callback
 

Dear visitor,

Your IP address shows that you are currently located in the USA. If you are a resident of the United States, you are prohibited from using the services of InstaFintech Group including online trading, online transfers, deposit/withdrawal of funds, etc.

If you think you are seeing this message by mistake and your location is not the US, kindly proceed to the website. Otherwise, you must leave the website in order to comply with government restrictions.

Why does your IP address show your location as the USA?

  • - you are using a VPN provided by a hosting company based in the United States;
  • - your IP does not have proper WHOIS records;
  • - an error occurred in the WHOIS geolocation database.

Please confirm whether you are a US resident or not by clicking the relevant button below. If you choose the wrong option, being a US resident, you will not be able to open an account with InstaForex anyway.

We are sorry for any inconvenience caused by this message.