empty
21.11.2024 06:26 AM
Trading Recommendations and Trade Analysis for EUR/USD on November 21: Flat Continues at the Lows

EUR/USD 5-Minute Analysis

This image is no longer relevant

The EUR/USD currency pair continued trading flat on Wednesday. As noted earlier, the pair has entered a consolidation phase due to a lack of buyers in the market and a pause taken by sellers. It's difficult to predict how long this flat period will last, but it's likely not a good time to trade within such a range. The horizontal channel has no clear boundaries, although a mild upward momentum is present. However, this movement cannot be considered a genuine upward correction. For now, waiting seems to be the best strategy.

Macroeconomic and fundamental events on Wednesday were negligible. A few minor reports were released but did not influence the pair's movements. This week, in general, is light on significant news, which explains the lack of direction. While we believe that the euro will decline in the medium term, occasional pauses are natural and beneficial for the market.

Among yesterday's trading signals, the price breaking below the 1.0581 level and the Kijun-sen line was notable, leading to a downward move of about 50 pips. However, within a flat market, Ichimoku indicator lines lose their strength. The price essentially ignored the next support level at 1.0533. While trading signals can still be sought, raising the bar for their reliability in such conditions is important.

COT Report

This image is no longer relevant

The latest COT report, dated November 12, shows that the net position of non-commercial traders has remained bullish for a long time. The last attempt by bears to gain dominance failed. However, a month ago, professional traders significantly increased their short positions, leading to the net position turning negative for the first time in a long period. This indicates that the euro is now being sold more frequently than bought.

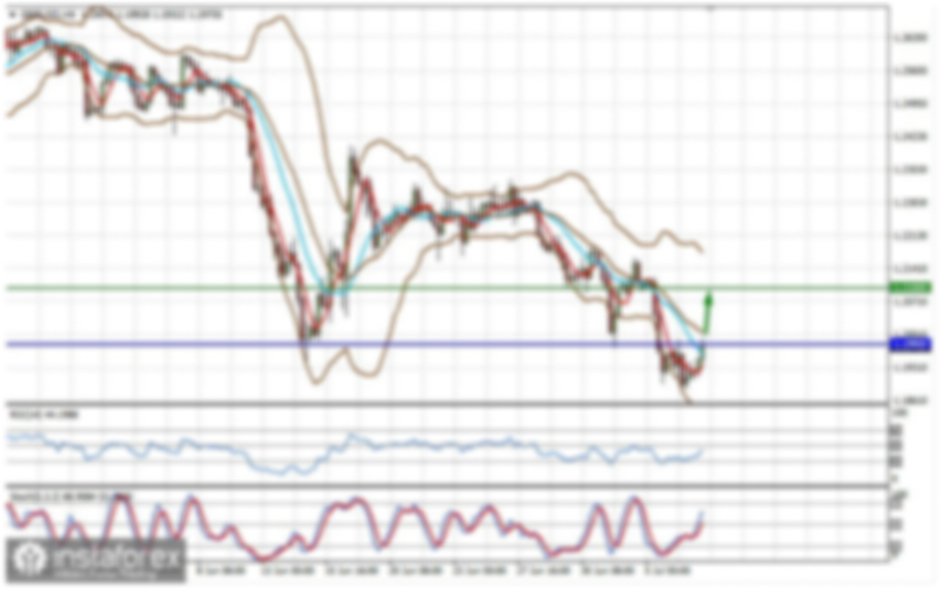
We still see no fundamental reasons for strengthening the euro, and technical analysis suggests the price remains in a consolidation zone—essentially a flat trend. On the weekly timeframe, it's clear that since December 2022, the pair has traded between 1.0448 and 1.1274. The market has transitioned from a seven-month flat phase to a 22-month phase. Thus, further decline remains likely toward 1.0448, which is only a short distance away.

Over the last reporting week, the number of long positions among the non-commercial group increased by 100, while short positions decreased by 14,100, causing the net position to grow by 14,200. The euro's downside potential remains significant.

EUR/USD 1-Hour Analysis

This image is no longer relevant

On the hourly timeframe, the pair continues its downward trend. There's no need to elaborate on the fundamental and macroeconomic reasons behind the euro's medium-term decline—they remain unchanged. In the medium term, further euro depreciation is expected. It's becoming increasingly clear that the market has fully priced in the Federal Reserve's monetary policy easing cycle. Additionally, the Fed shows no urgency in cutting rates further, making even minor upward corrections for the euro challenging.

For November 21, we highlight the following levels for trading: 1.0340-1.0366, 1.0485, 1.0581, 1.0658-1.0669, 1.0757, 1.0797, 1.0843, 1.0889, 1.0935, 1.1006, as well as the Senkou Span B (1.0767) and Kijun-sen (1.0575) lines. The Ichimoku lines may shift throughout the day, so they should be monitored for generating valid trading signals. Remember to use a Stop Loss order to secure breakeven if the price moves 15 pips in the intended direction to mitigate potential losses from false signals.

The economic calendar for Thursday offers little to focus on. In the U.S., minor reports such as unemployment claims and new home sales will be released, but these are unlikely to drive significant market movement or push the pair out of its flat range. Flat trading will probably persist.

Chart Explanations:

Support and resistance levels: thick red lines around which movement may end. They are not sources of trading signals.

Kijun-sen and Senkou Span B lines: Ichimoku indicator lines transferred from the 4-hour to the 1-hour timeframe. These are strong lines.

Extreme levels: thin red lines where the price previously rebounded. They are sources of trading signals.

Yellow lines: Trend lines, trend channels, and other technical patterns.

Indicator 1 on COT charts: The net position size for each category of traders.

Paolo Greco,
Analytical expert of InstaForex
© 2007-2025
Select timeframe
5
min
15
min
30
min
1
hour
4
hours
1
day
1
week
Earn on cryptocurrency rate changes with InstaForex
Download MetaTrader 4 and open your first trade
  • Grand Choice
    Contest by
    InstaForex
    InstaForex always strives to help you
    fulfill your biggest dreams.
    JOIN CONTEST

Recommended Stories

GBP/USD: Trading Plan for the U.S. Session on February 21st (Review of Morning Trades)

In my morning forecast, I focused on the 1.2640 level as a key decision point. Looking at the 5-minute chart, a false breakout at this support level provided a solid

Miroslaw Bawulski 16:24 2025-02-21 UTC+2

EUR/USD: Trading Plan for the U.S. Session on February 21st (Review of Morning Trades)

In my morning forecast, I focused on the 1.0475 level as a key entry point. Looking at the 5-minute chart, we can see that a false breakout at this level

Miroslaw Bawulski 16:17 2025-02-21 UTC+2

How to Trade the GBP/USD Pair on February 21? Simple Tips and Trade Analysis for Beginners

Analysis of Thursday's Trades 1H Chart of GBP/USD The GBP/USD pair traded higher on Thursday, even though there weren't any fundamental or macroeconomic reasons for this increase. Earlier

Paolo Greco 06:44 2025-02-21 UTC+2

How to Trade the EUR/USD Pair on February 21? Simple Tips and Trade Analysis for Beginners

Analysis of Thursday's Trades 1H Chart of EUR/USD The EUR/USD currency pair continued to exhibit extremely low volatility on Thursday, primarily influenced by technical factors. After failing to break through

Paolo Greco 06:44 2025-02-21 UTC+2

Trading Recommendations and Analysis for GBP/USD on February 21: The Pound Is Rising Rapidly

On Thursday, the GBP/USD currency pair initially remained stagnant but surged by nearly 100 pips. Such strong movements are rare, even after Bank of England or Federal Reserve meetings. However

Paolo Greco 06:06 2025-02-21 UTC+2

Trading Recommendations and Analysis for EUR/USD on February 21: The Euro Started to Rise Again

On Thursday, the EUR/USD currency pair resumed its upward movement, rebounding for the fifth or sixth time from the trendline. We did not expect the price to fail again

Paolo Greco 06:06 2025-02-21 UTC+2

GBP/USD: Trading Plan for the U.S. Session on February 20th (Review of Morning Trades)

In my morning forecast, I highlighted 1.2590 as a key level for making trading decisions. Looking at the 5-minute chart, we can see that a break and retest of 1.2590

Miroslaw Bawulski 14:11 2025-02-20 UTC+2

EUR/USD: Trading Plan for the U.S. Session on February 20th (Review of Morning Trades)

In my morning forecast, I highlighted the 1.0441 level as a key decision point for market entry. Looking at the 5-minute chart, we can see that the pair attempted

Miroslaw Bawulski 14:08 2025-02-20 UTC+2

How to Trade the GBP/USD Pair on February 20? Simple Tips and Trade Analysis for Beginners

Analysis of Wednesday's Trades 1H Chart of GBP/USD On Wednesday, the GBP/USD pair continued to trade in a sideways manner. For the second consecutive day, traders had ample reason

Paolo Greco 06:29 2025-02-20 UTC+2

How to Trade the EUR/USD Pair on February 20? Simple Tips and Trade Analysis for Beginners

Analysis of Wednesday's Trades 1H Chart of EUR/USD On Wednesday, the EUR/USD currency pair continued to experience minimal volatility and a downward trend. Throughout the day, several macroeconomic reports were

Paolo Greco 06:29 2025-02-20 UTC+2
Can't speak right now?
Ask your question in the chat.
Widget callback
 

Dear visitor,

Your IP address shows that you are currently located in the USA. If you are a resident of the United States, you are prohibited from using the services of InstaFintech Group including online trading, online transfers, deposit/withdrawal of funds, etc.

If you think you are seeing this message by mistake and your location is not the US, kindly proceed to the website. Otherwise, you must leave the website in order to comply with government restrictions.

Why does your IP address show your location as the USA?

  • - you are using a VPN provided by a hosting company based in the United States;
  • - your IP does not have proper WHOIS records;
  • - an error occurred in the WHOIS geolocation database.

Please confirm whether you are a US resident or not by clicking the relevant button below. If you choose the wrong option, being a US resident, you will not be able to open an account with InstaForex anyway.

We are sorry for any inconvenience caused by this message.