In my morning forecast, I focused on the level of 1.0886 and planned to make trading decisions based on it. Let's look at the 5-minute chart and analyze what happened. A breakout and retest of 1.0886 provided an entry point for buying the euro along the trend, resulting in a gain of more than 30 points. Selling on a false breakout from 1.0919 also allowed for around 30 points of profit. The technical outlook for the second half of the day has been revised.
To open long positions on EUR/USD:
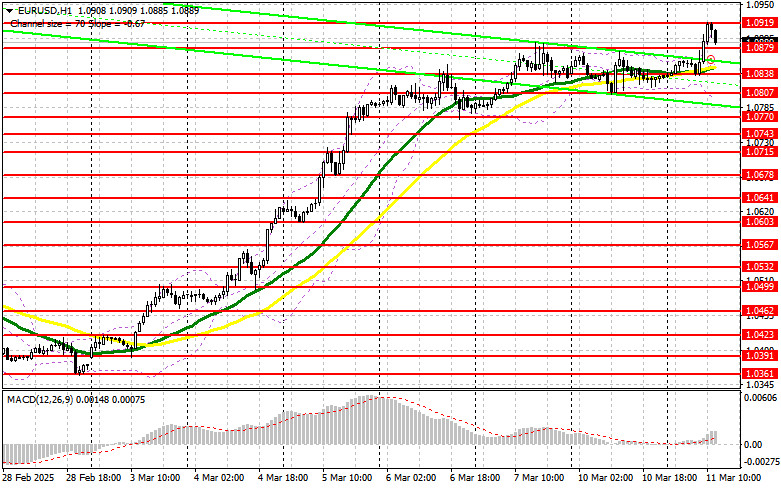
In the absence of statistics, the euro continued to rise, which was not surprising. Most likely, a similar scenario will unfold in the second half of the day, but for that, the pair should undergo a slight correction. Upcoming reports include the NFIB Small Business Optimism Index and the Job Openings and Labor Turnover Survey (JOLTS) from the US Bureau of Labor Statistics. If the data is strong, the euro may decline, which presents a buying opportunity. A false breakout around 1.0879 will be a signal for new purchases of EUR/USD, aiming for a further bullish market development with the prospect of updating 1.0919, the new local high. A breakout and retest of this range will confirm a proper entry point for buying, targeting 1.0952. The furthest target will be 1.0979, where I will lock in profits. If EUR/USD declines and there is no activity around 1.0879, which would only be possible with very strong US data or new statements from the Trump administration, demand for the euro will decrease, and the pair will settle into a new sideways range. Sellers will also be able to push the price down to 1.0838. I will consider buying the euro only after a false breakout at this level. I plan to open long positions immediately on a rebound from 1.0807, targeting a 30-35 point upward correction within the day.
To open short positions on EUR/USD:
Sellers did not attempt much today, as there was little reason to do so. If the pair continues to rise, which is the most likely scenario, only a false breakout at 1.0919, similar to what was discussed above, will provide an entry point for short positions, targeting a correction towards the 1.0879 support level. A breakout and consolidation below this range will be another good selling opportunity, with movement towards 1.0838, where the moving averages, favoring bulls, are located. The furthest target will be the 1.0807 area, where I will lock in profits. If EUR/USD moves higher in the second half of the day and bears show no activity around 1.0919, buyers may push for another significant rally. In this case, I will postpone short positions until the next resistance test at 1.0952. I will sell there, but only after an unsuccessful consolidation. I plan to open short positions immediately on a rebound from 1.0979, targeting a downward correction of 30-35 points.
The COT report (Commitment of Traders) for March 4 showed an increase in long positions and a significant reduction in short positions. More and more traders are willing to buy the euro. Germany's new fiscal policy aimed at stimulating the economy has renewed demand for the euro, leading to a significant strengthening against the US dollar. The European Central Bank's position on a more cautious approach to future rate cuts has also supported demand for EUR/USD, as reflected in the report. The previously slight advantage of euro sellers is no longer as relevant, but caution should be exercised when buying at current highs. The COT report indicated that long non-commercial positions increased by 2,524 to 185,223, while short non-commercial positions declined by 12,795 to 195,329. As a result, the net gap between long and short positions increased by 3,471.
Indicator Signals:
Moving Averages Trading is conducted above the 30- and 50-day moving averages, indicating a continued upward trend.
Note: The author considers the moving averages on the H1 hourly chart, which differs from the standard daily moving averages on the D1 daily chart.
Bollinger Bands In case of a decline, the lower boundary of the indicator at 1.0807 will serve as support.
Indicator Descriptions: • Moving Average (MA): Determines the current trend by smoothing out volatility and noise. Period – 50 (yellow on the chart). • Moving Average (MA): Determines the current trend by smoothing out volatility and noise. Period – 30 (green on the chart). • MACD (Moving Average Convergence/Divergence): EMA fast period – 12, EMA slow period – 26, SMA period – 9. • Bollinger Bands: Period – 20. • Non-commercial traders: Speculators, including individual traders, hedge funds, and large institutions that use the futures market for speculative purposes and meet specific criteria. • Long non-commercial positions: Represent the total long open positions of non-commercial traders. • Short non-commercial positions: Represent the total short open positions of non-commercial traders. • Total non-commercial net position: The difference between short and long positions of non-commercial traders.