EUR/USD 5-Minute Analysis
The EUR/USD currency pair began a sharp pullback on Friday after a strong rally on Wednesday evening and Thursday. There are different ways to interpret this decline, but we want to highlight two key points. First, volatility has been extremely high recently, and the fundamental background is intense. This means the price movements are powerful and aggressive. As a result, traders cannot rely on precise or pinpoint level execution to generate trading signals. Second, it's unclear what exact factors are currently driving price formation. On Friday, the dollar could have continued falling or remained near its lows, but it rebounded by about 150–200 pips. Why did it rebound? Perhaps market participants began locking in profits from short dollar positions. Federal Reserve Chair Jerome Powell's hawkish speech and the Fed's apparent indifference to Trump's economic troubles played a role. Or maybe the Nonfarm Payrolls report helped.
From a technical perspective, there's little to comment on regarding the hourly timeframe. The "wild swings" seen in recent days cannot be packed into a clear trend or direction. Trend lines are absent, though the overall upward trend is evident. Due to the strength of recent moves, even a break below the critical line doesn't mean much. A new rally could resume as early as Monday. The EU, China, and other sanctioned countries may impose retaliatory tariffs, which could spark another market storm.
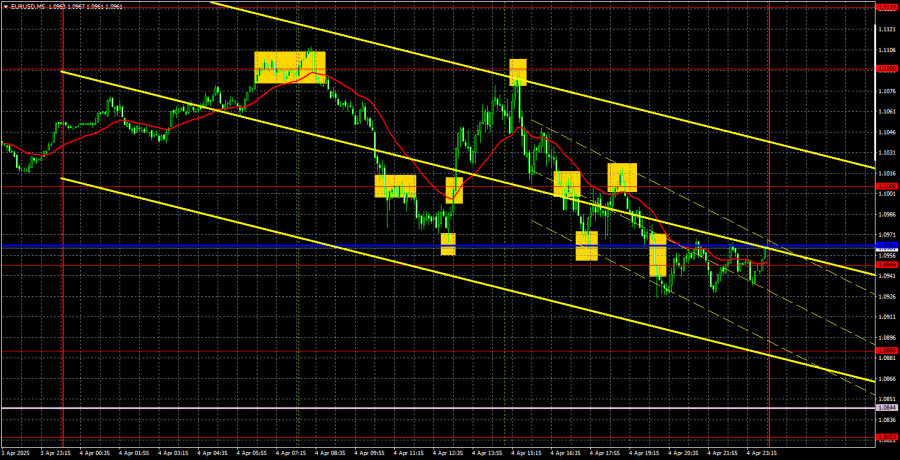
In the 5-minute timeframe, Friday generated a vast number of trading signals. There's no point listing them all. We'd like to note that many signals might look attractive on charts, but they were random or imprecise. If dollar strength was expected during the U.S. session, how can we explain a 120-pip euro rally during the European session? A technical bounce off the critical line?
COT Report
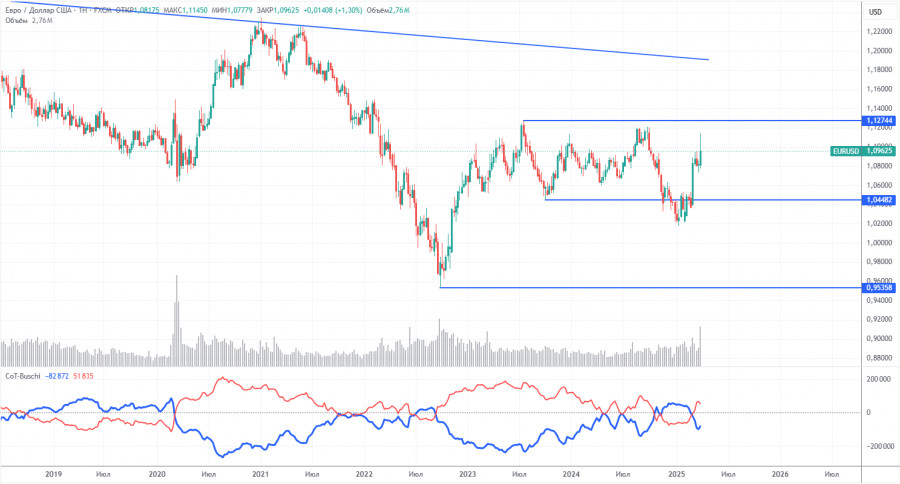
The latest COT report is dated April 1. As shown in the chart, the net position of non-commercial traders remained bullish for a long time. The bears barely managed to gain control briefly, but now the bulls are back in charge. The bears' advantage has faded fast since Trump took office, and the dollar has since plunged. We cannot say definitively that the dollar's decline will continue, and the COT reports reflect sentiment among major players, which can shift quickly in today's environment.
We still see no fundamental factors supporting euro strength—but one decisive factor for dollar weakness has emerged. The correction may last for weeks or even months, but a 16-year downward trend isn't going to end so quickly.
The red and blue lines have crossed again, indicating a bullish market trend. During the latest reporting week, the number of long positions in the "non-commercial" group fell by 6,500, while short positions increased by 7,100. As a result, the net position declined by 13,600 contracts.
EUR/USD 1-Hour Analysis
In the hourly timeframe, EUR/USD quickly resumed its upward movement as soon as Trump announced new tariffs. We believe a pullback will occur in the medium term due to the divergence in ECB and Fed monetary policies. However, it's impossible to know how long the market will continue reacting only to "Trump factors." Traders ignore many reports and data; the dollar is sold off at every opportunity and can't rally even when favorable conditions exist. No one knows when and what new tariffs Trump may introduce, so even a 2-week outlook is currently meaningless.
For April 7, we highlight the following trading levels: 1.0461, 1.0524, 1.0585, 1.0658–1.0669, 1.0757, 1.0797, 1.0823, 1.0886, 1.0949, 1.1006, 1.1092, 1.1147, 1.1185, 1.1234, as well as the Senkou Span B line (1.0844) and Kijun-sen (1.0963). The Ichimoku indicator lines may shift during the day, so they should be monitored for trading signals. Don't forget to set your Stop Loss to breakeven if the price moves 15 pips in your favor to protect against false signals.
Germany will release industrial production data on Monday, and the EU will publish retail sales figures. These reports are unlikely to attract much attention from traders. The market will instead focus on retaliatory tariffs against the U.S. and new decisions or statements from Donald Trump. Despite being a Monday, volatility may remain high.
Illustration Explanations:
- Support and Resistance Levels (thick red lines): Thick red lines indicate where movement may come to an end. Please note that these lines are not sources of trading signals.
- Kijun-sen and Senkou Span B Lines: Ichimoku indicator lines transferred from the 4-hour timeframe to the hourly timeframe. These are strong lines.
- Extreme Levels (thin red lines): Thin red lines where the price has previously bounced. These serve as sources of trading signals.
- Yellow Lines: Trendlines, trend channels, or any other technical patterns.
- Indicator 1 on COT Charts: Represents the net position size for each category of traders.


