

signal strength 1 of 5
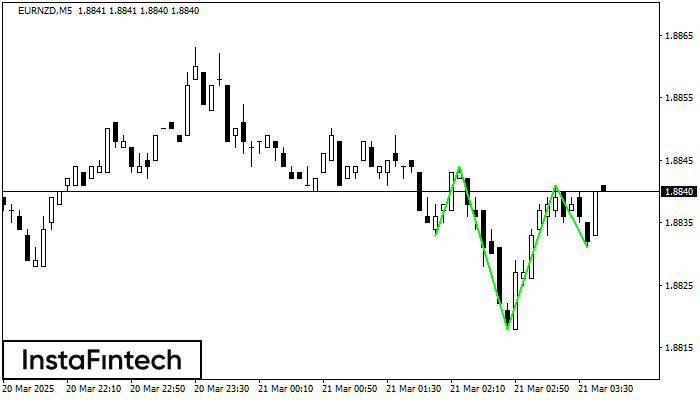
According to the chart of M5, EURNZD formed the Inverse Head and Shoulder pattern. The Head’s top is set at 1.8841 while the median line of the Neck is found at 1.8818/1.8831. The formation of the Inverse Head and Shoulder pattern evidently signals a reversal of the downward trend. In other words, in case the scenario comes true, the price of EURNZD will go towards 1.8856
The M5 and M15 time frames may have more false entry points.
See Also
- All
- Double Top
- Flag
- Head and Shoulders
- Pennant
- Rectangle
- Triangle
- Triple top
- All
- #AAPL
- #AMZN
- #Bitcoin
- #EBAY
- #FB
- #GOOG
- #INTC
- #KO
- #MA
- #MCD
- #MSFT
- #NTDOY
- #PEP
- #TSLA
- #TWTR
- AUDCAD
- AUDCHF
- AUDJPY
- AUDUSD
- EURCAD
- EURCHF
- EURGBP
- EURJPY
- EURNZD
- EURRUB
- EURUSD
- GBPAUD
- GBPCHF
- GBPJPY
- GBPUSD
- GOLD
- NZDCAD
- NZDCHF
- NZDJPY
- NZDUSD
- SILVER
- USDCAD
- USDCHF
- USDJPY
- USDRUB
- All
- M5
- M15
- M30
- H1
- D1
- All
- Buy
- Sale
- All
- 1
- 2
- 3
- 4
- 5
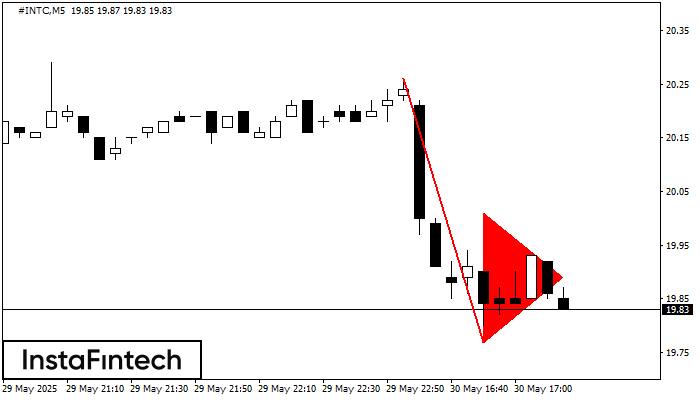
The Bearish pennant pattern has formed on the #INTC M5 chart. The pattern signals continuation of the downtrend in case the pennant’s low of 19.77 is broken through. Recommendations: Place
The M5 and M15 time frames may have more false entry points.
Open chart in a new window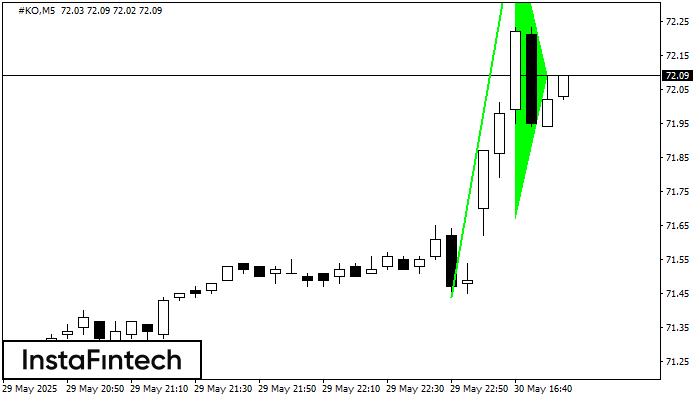
The Bullish pennant signal – Trading instrument #KO M5, continuation pattern. Forecast: it is possible to set up a buy position above the pattern’s high of 72.50, with the prospect
The M5 and M15 time frames may have more false entry points.
Open chart in a new window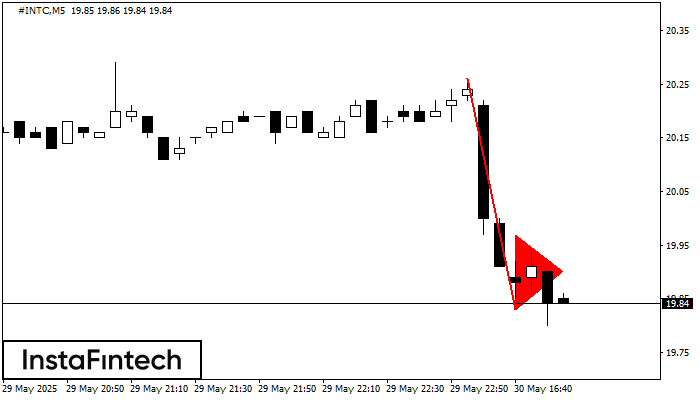
The Bearish pennant pattern has formed on the #INTC M5 chart. The pattern signals continuation of the downtrend in case the pennant’s low of 19.83 is broken through. Recommendations: Place
The M5 and M15 time frames may have more false entry points.
Open chart in a new window


