


signal strength 1 of 5
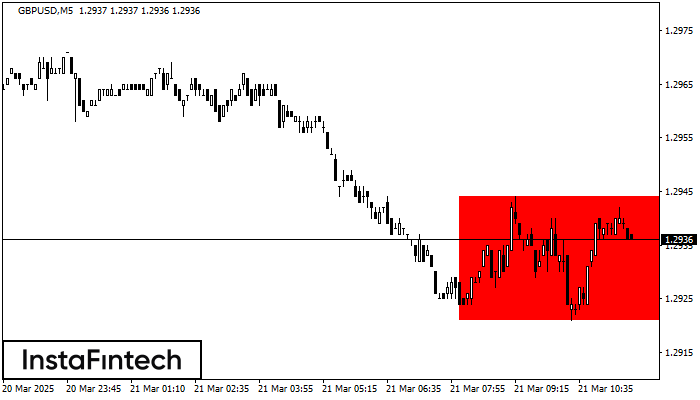
According to the chart of M5, GBPUSD formed the Bearish Rectangle. The pattern indicates a trend continuation. The upper border is 1.2944, the lower border is 1.2921. The signal means that a short position should be opened after fixing a price below the lower border 1.2921 of the Bearish Rectangle.
The M5 and M15 time frames may have more false entry points.
See Also
- All
- Double Top
- Flag
- Head and Shoulders
- Pennant
- Rectangle
- Triangle
- Triple top
- All
- #AAPL
- #AMZN
- #Bitcoin
- #EBAY
- #FB
- #GOOG
- #INTC
- #KO
- #MA
- #MCD
- #MSFT
- #NTDOY
- #PEP
- #TSLA
- #TWTR
- AUDCAD
- AUDCHF
- AUDJPY
- AUDUSD
- EURCAD
- EURCHF
- EURGBP
- EURJPY
- EURNZD
- EURRUB
- EURUSD
- GBPAUD
- GBPCHF
- GBPJPY
- GBPUSD
- GOLD
- NZDCAD
- NZDCHF
- NZDJPY
- NZDUSD
- SILVER
- USDCAD
- USDCHF
- USDJPY
- USDRUB
- All
- M5
- M15
- M30
- H1
- D1
- All
- Buy
- Sale
- All
- 1
- 2
- 3
- 4
- 5
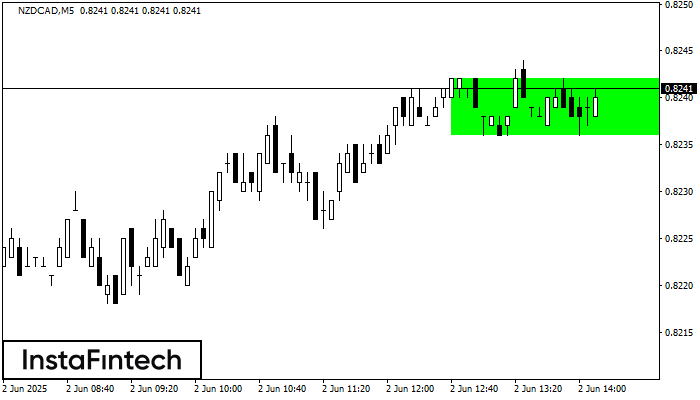
Сформирована фигура «Прямоугольник» на графике NZDCAD M5. Тип фигуры: Продолжение тренда; Границы: Верхняя 0.8242, Нижняя 0.8236; Сигнал: позицию на покупку следует открывать выше верхней границы прямоугольника 0.8242
Таймфреймы М5 и М15 могут иметь больше ложных точек входа.
Открыть график инструмента в новом окне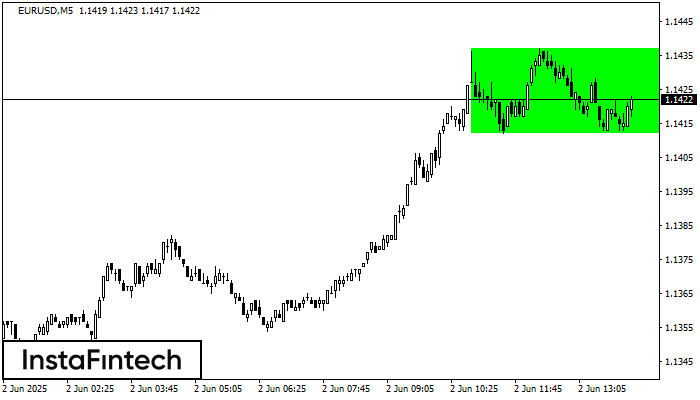
По EURUSD на M5 сформировалась фигура «Прямоугольник». Фигура данного типа относится к тому типу продолжения тренда, который содержит в себе два уровня: Сопротивление 1.1437; Поддержка 1.1412. В случае пробоя уровня
Таймфреймы М5 и М15 могут иметь больше ложных точек входа.
Открыть график инструмента в новом окне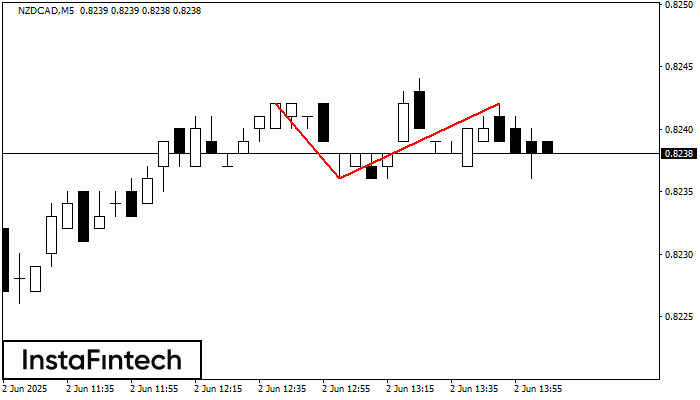
По NZDCAD на M5 сформировалась разворотная фигура «Двойная вершина». Характеристика: Верхняя граница 0.8242; Нижняя граница 0.8236; Ширина фигуры 6 пунктов. Позицию на продажу возможно открыть ниже нижней границы 0.8236
Таймфреймы М5 и М15 могут иметь больше ложных точек входа.
Открыть график инструмента в новом окне


