


signal strength 1 of 5
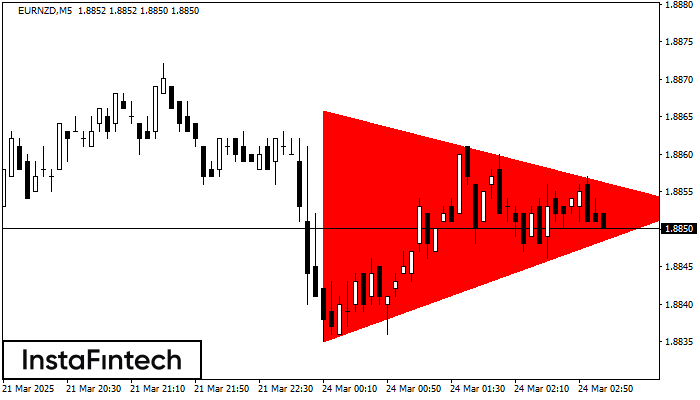
According to the chart of M5, EURNZD formed the Bearish Symmetrical Triangle pattern. Description: The lower border is 1.8835/1.8853 and upper border is 1.8866/1.8853. The pattern width is measured on the chart at -31 pips. The formation of the Bearish Symmetrical Triangle pattern evidently signals a continuation of the downward trend. In other words, if the scenario comes true and EURNZD breaches the lower border, the price could continue its move toward 1.8838.
The M5 and M15 time frames may have more false entry points.
See Also
- All
- Double Top
- Flag
- Head and Shoulders
- Pennant
- Rectangle
- Triangle
- Triple top
- All
- #AAPL
- #AMZN
- #Bitcoin
- #EBAY
- #FB
- #GOOG
- #INTC
- #KO
- #MA
- #MCD
- #MSFT
- #NTDOY
- #PEP
- #TSLA
- #TWTR
- AUDCAD
- AUDCHF
- AUDJPY
- AUDUSD
- EURCAD
- EURCHF
- EURGBP
- EURJPY
- EURNZD
- EURRUB
- EURUSD
- GBPAUD
- GBPCHF
- GBPJPY
- GBPUSD
- GOLD
- NZDCAD
- NZDCHF
- NZDJPY
- NZDUSD
- SILVER
- USDCAD
- USDCHF
- USDJPY
- USDRUB
- All
- M5
- M15
- M30
- H1
- D1
- All
- Buy
- Sale
- All
- 1
- 2
- 3
- 4
- 5
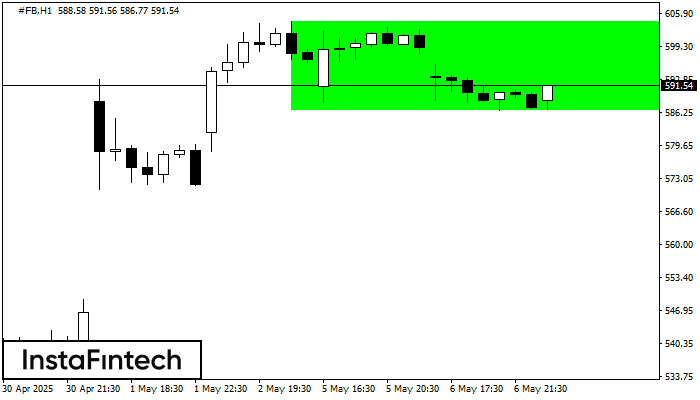
According to the chart of H1, #FB formed the Bullish Rectangle. The pattern indicates a trend continuation. The upper border is 604.25, the lower border is 586.62. The signal means
Open chart in a new window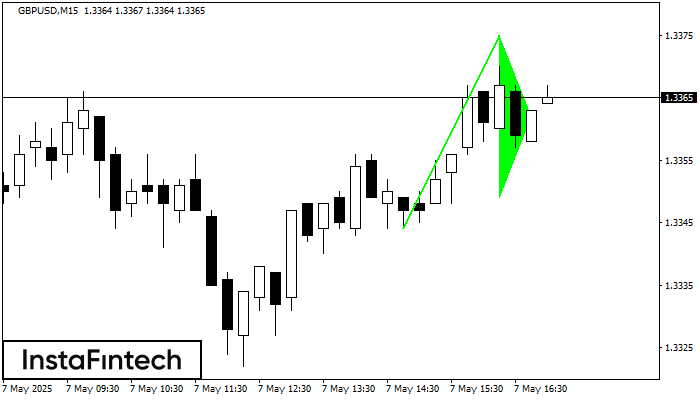
The Bullish pennant signal – Trading instrument GBPUSD M15, continuation pattern. Forecast: it is possible to set up a buy position above the pattern’s high of 1.3375, with the prospect
The M5 and M15 time frames may have more false entry points.
Open chart in a new window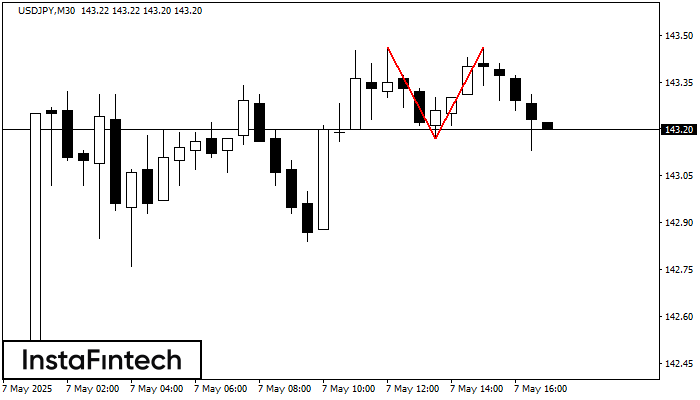
On the chart of USDJPY M30 the Double Top reversal pattern has been formed. Characteristics: the upper boundary 143.46; the lower boundary 143.17; the width of the pattern 29 points
Open chart in a new window


