


signal strength 1 of 5
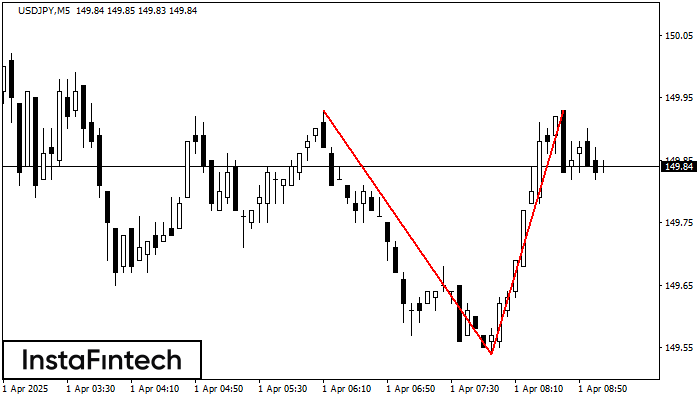
The Double Top pattern has been formed on USDJPY M5. It signals that the trend has been changed from upwards to downwards. Probably, if the base of the pattern 149.54 is broken, the downward movement will continue.
The M5 and M15 time frames may have more false entry points.
- All
- Double Top
- Flag
- Head and Shoulders
- Pennant
- Rectangle
- Triangle
- Triple top
- All
- #AAPL
- #AMZN
- #Bitcoin
- #EBAY
- #FB
- #GOOG
- #INTC
- #KO
- #MA
- #MCD
- #MSFT
- #NTDOY
- #PEP
- #TSLA
- #TWTR
- AUDCAD
- AUDCHF
- AUDJPY
- AUDUSD
- EURCAD
- EURCHF
- EURGBP
- EURJPY
- EURNZD
- EURRUB
- EURUSD
- GBPAUD
- GBPCHF
- GBPJPY
- GBPUSD
- GOLD
- NZDCAD
- NZDCHF
- NZDJPY
- NZDUSD
- SILVER
- USDCAD
- USDCHF
- USDJPY
- USDRUB
- All
- M5
- M15
- M30
- H1
- D1
- All
- Buy
- Sale
- All
- 1
- 2
- 3
- 4
- 5

No gráfico do instrumento de negociação #Bitcoin M15, o padrão Topo triplo que sinaliza uma mudança de tendência se formou. É possível que após a formação do terceiro pico
Os intervalos M5 e M15 podem ter mais pontos de entrada falsos.
Open chart in a new window
O padrão de reversão Topo duplo foi formado em #Bitcoin M30. Características: o limite superior 104800.13; o limite inferior 104215.56; a largura do padrão é de 64024 pontos. As operações
Open chart in a new window
De acordo com o gráfico de M5, #Bitcoin formou o Retângulo de alta que é um padrão de uma continuação da tendência. O padrão está dentro dos seguintes limites
Os intervalos M5 e M15 podem ter mais pontos de entrada falsos.
Open chart in a new window


