


signal strength 1 of 5
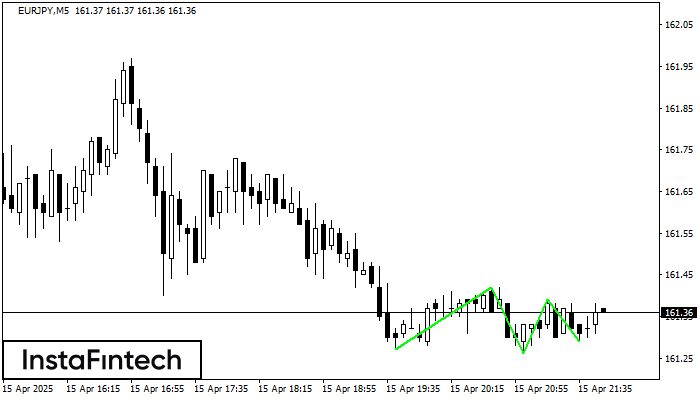
The Triple Bottom pattern has been formed on EURJPY M5. It has the following characteristics: resistance level 161.42/161.39; support level 161.27/161.29; the width is 15 points. In the event of a breakdown of the resistance level of 161.42, the price is likely to continue an upward movement at least to 161.41.
The M5 and M15 time frames may have more false entry points.
- All
- Double Top
- Flag
- Head and Shoulders
- Pennant
- Rectangle
- Triangle
- Triple top
- All
- #AAPL
- #AMZN
- #Bitcoin
- #EBAY
- #FB
- #GOOG
- #INTC
- #KO
- #MA
- #MCD
- #MSFT
- #NTDOY
- #PEP
- #TSLA
- #TWTR
- AUDCAD
- AUDCHF
- AUDJPY
- AUDUSD
- EURCAD
- EURCHF
- EURGBP
- EURJPY
- EURNZD
- EURRUB
- EURUSD
- GBPAUD
- GBPCHF
- GBPJPY
- GBPUSD
- GOLD
- NZDCAD
- NZDCHF
- NZDJPY
- NZDUSD
- SILVER
- USDCAD
- USDCHF
- USDJPY
- USDRUB
- All
- M5
- M15
- M30
- H1
- D1
- All
- Buy
- Sale
- All
- 1
- 2
- 3
- 4
- 5
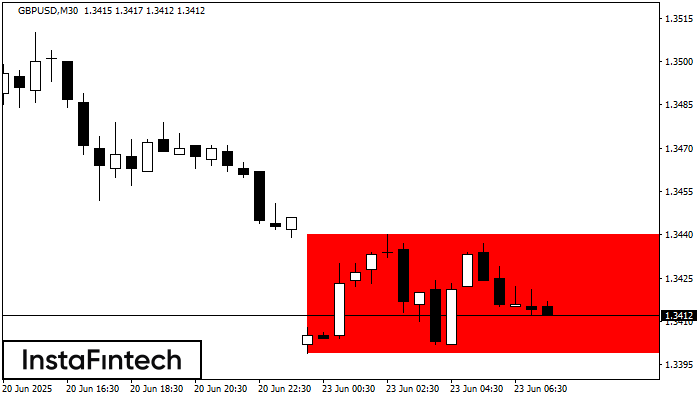
De acordo com o gráfico de M30, GBPUSD formou Retângulo de baixa que é um padrão de uma continuação de tendência. O padrão está dentro dos seguintes limites: limite inferior
Open chart in a new window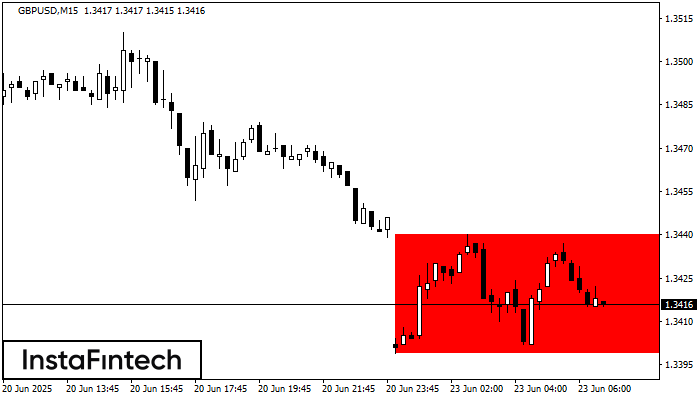
De acordo com o gráfico de M15, GBPUSD formou Retângulo de baixa. O padrão indica uma continuação da tendência. O limite superior é 1.3440, o limite inferior é 1.3399
Os intervalos M5 e M15 podem ter mais pontos de entrada falsos.
Open chart in a new window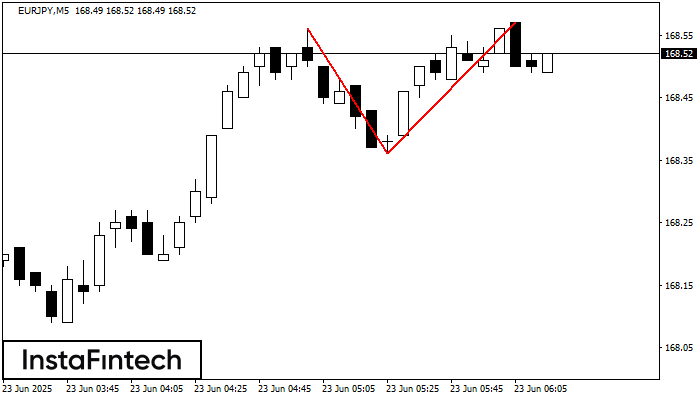
No gráfico de EURJPY M5 o padrão de reversão Topo duplo foi formado. Características: o limite superior 168.57; o limite inferior 168.36; a largura do padrão 21 pontos. O sinal
Os intervalos M5 e M15 podem ter mais pontos de entrada falsos.
Open chart in a new window


