empty
27.11.2023 09:25 PM
Technical analysis on EUR/USD on November 27, 2023

This image is no longer relevant

Overview :

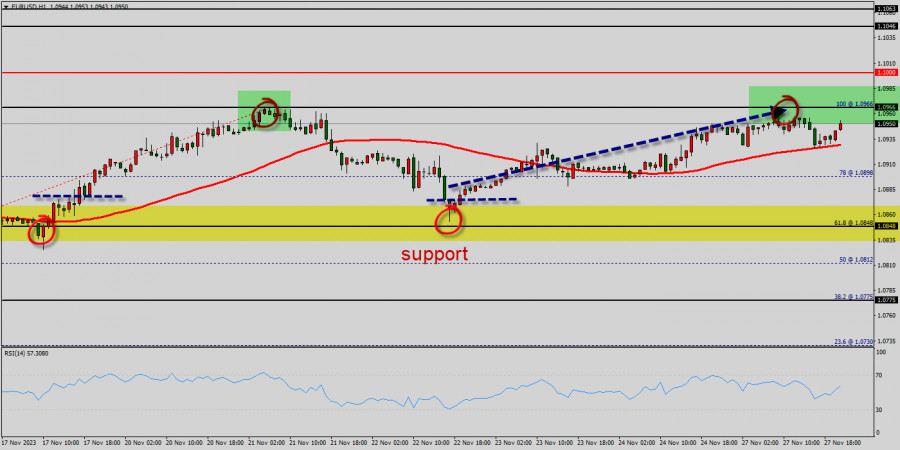
The trend of EUR/USD pair movement was controversial as it took place in a narrow sideways channel, the market showed signs of instability. Amid the previous events, the price is still moving between the levels of 1.0848 and 1.0966. Also, the daily resistance and support are seen at the levels of 1.0966 and 1.0848 respectively.

Therefore, it is recommended to be cautious while placing orders in this area. So, we need to wait until the sideways channel has completed. Last week, the market moved from its bottom at 1.0848 and continued to rise towards the top of 1.0966. Today, in the one-hour chart, the current rise will remain within a framework of correction.

The Relative Strength Index (RSI) is considered overbought because it is below 60. The RSI is still signaling that the trend is downward, but it is still strong above the moving average (100). This suggests the pair will probably go down in coming hours. Accordingly, the market is likely to show signs of a bearish trend.

However, if the pair fails to pass through the level of 1.0966, the market will indicate a bearish opportunity below the strong resistance level of 1.0966 (the level of 1.0966 coincides with the double top too). Since there is nothing new in this market, it is not bullish yet. Sell deals are recommended below the level of 1.0966 with the first target at 1.0848.

If the trend breaks the support level of 1.0848, the pair is likely to move downwards continuing the development of a bearish trend to the level 1.0725 in order to test the daily support 2 (horizontal balck line).

Select timeframe
5
min
15
min
30
min
1
hour
4
hours
1
day
1
week
Earn on cryptocurrency rate changes with InstaForex
Download MetaTrader 4 and open your first trade
  • Grand Choice
    Contest by
    InstaForex
    InstaForex always strives to help you
    fulfill your biggest dreams.
    JOIN CONTEST

Recommended Stories

Forecast for EUR/USD on June 25, 2025

On Tuesday, the EUR/USD pair continued its upward movement and nearly reached the 1.1645 level. A rebound from this level would favor the US dollar and lead to a decline

Samir Klishi 12:49 2025-06-25 UTC+2

Forecast for GBP/USD on June 25, 2025

On the hourly chart, the GBP/USD pair continued its upward movement on Tuesday toward the resistance zone of 1.3611–1.3633. This is already the fifth attempt by the bulls to secure

Samir Klishi 12:46 2025-06-25 UTC+2

Forex forecast 25/06/2025: EUR/USD, USD/JPY, SP500, NDX, INDU and Bitcoin

Useful links: My other articles are available in this section InstaForex course for beginners Popular Analytics Open trading account Important: The begginers in forex trading need to be very careful

Sebastian Seliga 10:03 2025-06-25 UTC+2

EUR/USD still trying to test the 1st Resistance level, Wednesday, June 25,2025.

EUR/USD is currently moving between the 1st Pivot and Resistance zone level area with an uptrend bias. Key Levels 1. Resistance. 2: 1.16753. 2. Resistance. 1: 1.16419. 3. Pivot

Arief Makmur 09:13 2025-06-25 UTC+2

The strengthening that occurred in USD/JPY is just a momentary correction. Wednesday, June 25, 2025.

Although there is a potential for strengthening correction, USD/JPY still has the opportunity to weaken again in line with the previous bias. Key Levels 1. Resistance. 2 : 145.839

Arief Makmur 09:13 2025-06-25 UTC+2

EUR/USD Forecast for June 25, 2025

The euro continues its movement toward the projected target of 1.1820, which is the upper boundary of the price channel. Yesterday's growth totaled 32 pips. Bears can reverse the trend

Laurie Bailey 05:12 2025-06-25 UTC+2

GBP/USD Forecast for June 25, 2025

The British pound has reached the target level of 1.3635. As of this morning, it is preparing to surpass yesterday's high to continue its rise toward the next target

Laurie Bailey 05:12 2025-06-25 UTC+2

Oil Forecast for June 25, 2025

After two days of significant decline, the price has reached the target level of 64.00, which had previously acted as strong support in March and April 2023 and as resistance

Laurie Bailey 05:12 2025-06-25 UTC+2

XAU/USD. Analysis and Forecast. Current Market Situation

From a technical standpoint, gold on the 4-hour chart has established acceptance below the 100-period Simple Moving Average (SMA), signaling a potential continuation of the decline. Moreover, oscillators

Irina Yanina 18:27 2025-06-24 UTC+2

Trading Signals for GOLD (XAU/USD) for June 24-28, 2025: sell below $3,327 (21 SMA - 200 EMA)

This area of 3,300 represents strong support, but we believe gold could make a technical rebound in the coming hours toward 3,327. At this point, it could resume its bearish

Dimitrios Zappas 18:05 2025-06-24 UTC+2
Can't speak right now?
Ask your question in the chat.
Widget callback
 

Dear visitor,

Your IP address shows that you are currently located in the USA. If you are a resident of the United States, you are prohibited from using the services of InstaFintech Group including online trading, online transfers, deposit/withdrawal of funds, etc.

If you think you are seeing this message by mistake and your location is not the US, kindly proceed to the website. Otherwise, you must leave the website in order to comply with government restrictions.

Why does your IP address show your location as the USA?

  • - you are using a VPN provided by a hosting company based in the United States;
  • - your IP does not have proper WHOIS records;
  • - an error occurred in the WHOIS geolocation database.

Please confirm whether you are a US resident or not by clicking the relevant button below. If you choose the wrong option, being a US resident, you will not be able to open an account with InstaForex anyway.

We are sorry for any inconvenience caused by this message.