

signal strength 1 of 5

The Double Bottom pattern has been formed on #AAPL M5. This formation signals a reversal of the trend from downwards to upwards. The signal is that a buy trade should be opened after the upper boundary of the pattern 180.32 is broken. The further movements will rely on the width of the current pattern 444 points.
The M5 and M15 time frames may have more false entry points.
See Also
- All
- Double Top
- Flag
- Head and Shoulders
- Pennant
- Rectangle
- Triangle
- Triple top
- All
- #AAPL
- #AMZN
- #Bitcoin
- #EBAY
- #FB
- #GOOG
- #INTC
- #KO
- #MA
- #MCD
- #MSFT
- #NTDOY
- #PEP
- #TSLA
- #TWTR
- AUDCAD
- AUDCHF
- AUDJPY
- AUDUSD
- EURCAD
- EURCHF
- EURGBP
- EURJPY
- EURNZD
- EURRUB
- EURUSD
- GBPAUD
- GBPCHF
- GBPJPY
- GBPUSD
- GOLD
- NZDCAD
- NZDCHF
- NZDJPY
- NZDUSD
- SILVER
- USDCAD
- USDCHF
- USDJPY
- USDRUB
- All
- M5
- M15
- M30
- H1
- D1
- All
- Buy
- Sale
- All
- 1
- 2
- 3
- 4
- 5
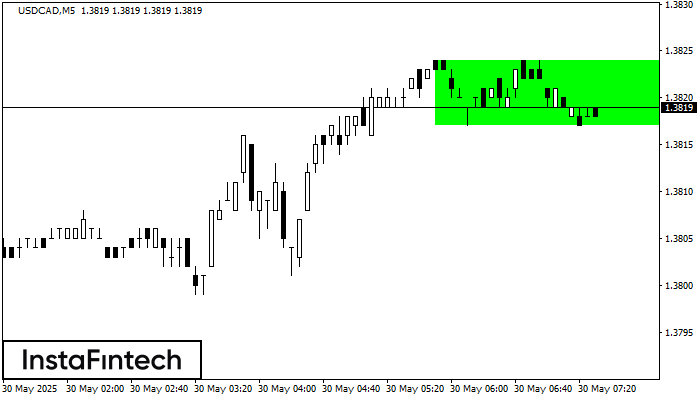
According to the chart of M5, USDCAD formed the Bullish Rectangle. This type of a pattern indicates a trend continuation. It consists of two levels: resistance 1.3824 and support 1.3817
The M5 and M15 time frames may have more false entry points.
Open chart in a new window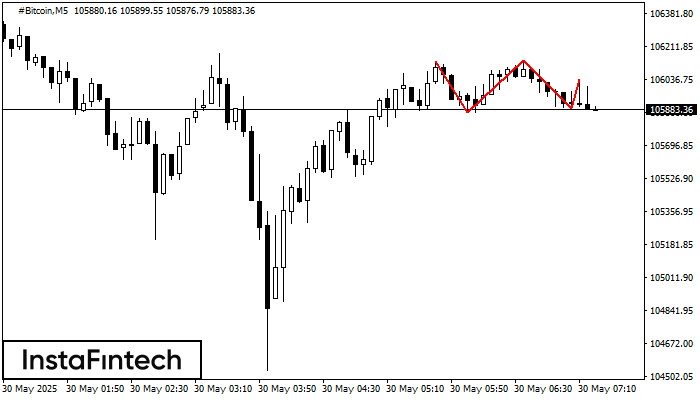
On the chart of the #Bitcoin M5 trading instrument, the Triple Top pattern that signals a trend change has formed. It is possible that after formation of the third peak
The M5 and M15 time frames may have more false entry points.
Open chart in a new window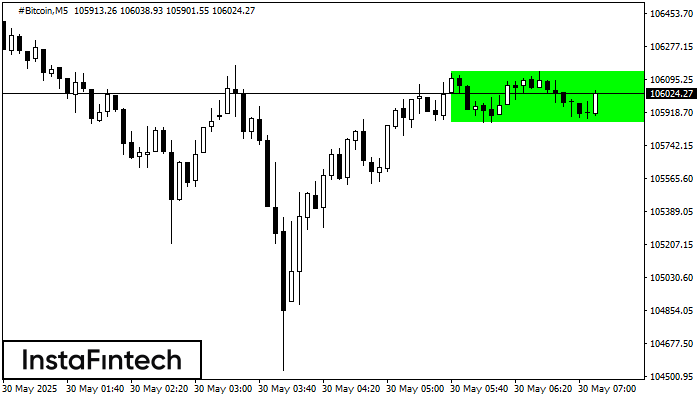
According to the chart of M5, #Bitcoin formed the Bullish Rectangle. The pattern indicates a trend continuation. The upper border is 106138.63, the lower border is 105867.53. The signal means
The M5 and M15 time frames may have more false entry points.
Open chart in a new window


