

signal strength 2 of 5

The Bullish Flag pattern has been formed on the chart NZDJPY M15 which signals that the upward trend will continue. Signals: а break of the peak at 86.28 may push the price higher, and the rise will be the projection of the pole.
The M5 and M15 time frames may have more false entry points.
See Also
- All
- Double Top
- Flag
- Head and Shoulders
- Pennant
- Rectangle
- Triangle
- Triple top
- All
- #AAPL
- #AMZN
- #Bitcoin
- #EBAY
- #FB
- #GOOG
- #INTC
- #KO
- #MA
- #MCD
- #MSFT
- #NTDOY
- #PEP
- #TSLA
- #TWTR
- AUDCAD
- AUDCHF
- AUDJPY
- AUDUSD
- EURCAD
- EURCHF
- EURGBP
- EURJPY
- EURNZD
- EURRUB
- EURUSD
- GBPAUD
- GBPCHF
- GBPJPY
- GBPUSD
- GOLD
- NZDCAD
- NZDCHF
- NZDJPY
- NZDUSD
- SILVER
- USDCAD
- USDCHF
- USDJPY
- USDRUB
- All
- M5
- M15
- M30
- H1
- D1
- All
- Buy
- Sale
- All
- 1
- 2
- 3
- 4
- 5
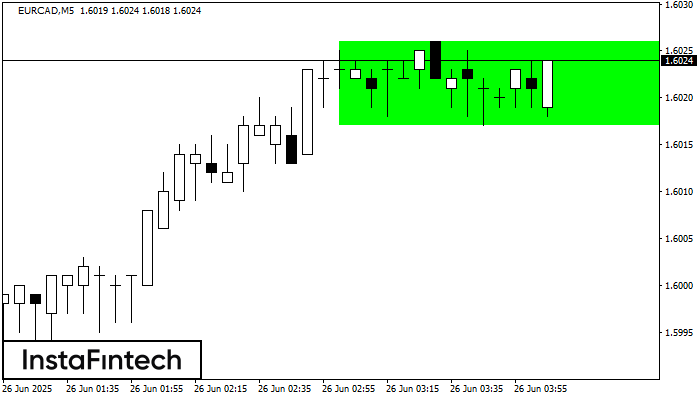
Сформирована фигура «Прямоугольник» на графике EURCAD M5. Тип фигуры: Продолжение тренда; Границы: Верхняя 1.6026, Нижняя 1.6017; Сигнал: позицию на покупку следует открывать выше верхней границы прямоугольника 1.6026
Таймфреймы М5 и М15 могут иметь больше ложных точек входа.
Открыть график инструмента в новом окне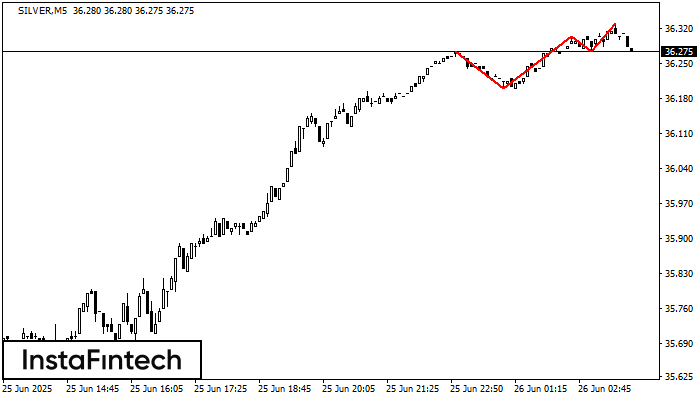
На графике SILVER M5 образовалась фигура «Тройная вершина». Данная фигура относится к типу разворотных и имеет характеристику: Верхняя граница 36.27/36.33; Нижняя граница 36.20/36.27; Ширина фигуры 30 пунктов. Прогноз: В случае
Таймфреймы М5 и М15 могут иметь больше ложных точек входа.
Открыть график инструмента в новом окне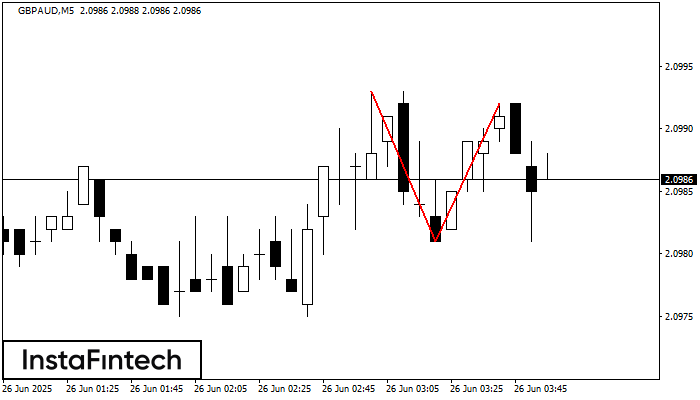
На торговом графике GBPAUD M5 сформировалась разворотная фигура «Двойная вершина». Характеристика: Верхняя граница 2.0992; Нижняя граница 2.0981; Ширина фигуры 11 пунктов. Сигнал: Пробой нижней границы 2.0981 приведет к дальнейшему нисходящему
Таймфреймы М5 и М15 могут иметь больше ложных точек входа.
Открыть график инструмента в новом окне


