


signal strength 1 of 5
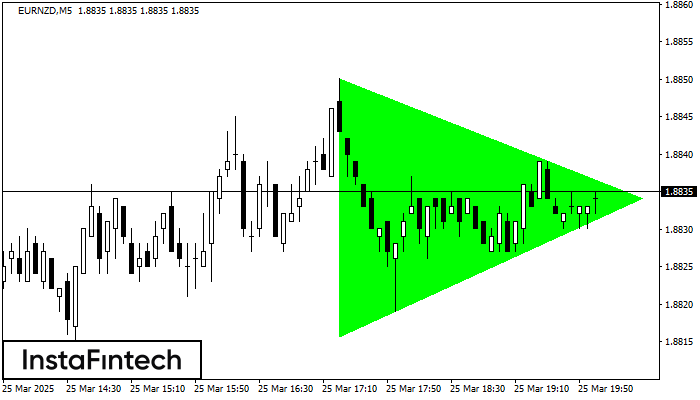
According to the chart of M5, EURNZD formed the Bullish Symmetrical Triangle pattern, which signals the trend will continue. Description. The upper border of the pattern touches the coordinates 1.8850/1.8834 whereas the lower border goes across 1.8816/1.8834. The pattern width is measured on the chart at 34 pips. If the Bullish Symmetrical Triangle pattern is in progress during the upward trend, this indicates the current trend will go on. In case 1.8834 is broken, the price could continue its move toward 1.8849.
The M5 and M15 time frames may have more false entry points.
See Also
- All
- Double Top
- Flag
- Head and Shoulders
- Pennant
- Rectangle
- Triangle
- Triple top
- All
- #AAPL
- #AMZN
- #Bitcoin
- #EBAY
- #FB
- #GOOG
- #INTC
- #KO
- #MA
- #MCD
- #MSFT
- #NTDOY
- #PEP
- #TSLA
- #TWTR
- AUDCAD
- AUDCHF
- AUDJPY
- AUDUSD
- EURCAD
- EURCHF
- EURGBP
- EURJPY
- EURNZD
- EURRUB
- EURUSD
- GBPAUD
- GBPCHF
- GBPJPY
- GBPUSD
- GOLD
- NZDCAD
- NZDCHF
- NZDJPY
- NZDUSD
- SILVER
- USDCAD
- USDCHF
- USDJPY
- USDRUB
- All
- M5
- M15
- M30
- H1
- D1
- All
- Buy
- Sale
- All
- 1
- 2
- 3
- 4
- 5

По GBPUSD на M15 сформировалась фигура «Бычий флаг». Нижняя граница фигуры имеет координаты 1.3255/1.3255, при этом верхняя граница 1.3263/1.3263. Проекция высоты флагштока 19 пунктов. Формирование фигуры «Бычий флаг» наиболее вероятным
Таймфреймы М5 и М15 могут иметь больше ложных точек входа.
Открыть график инструмента в новом окне
По AUDCAD на M15 сформировалась фигура «Бычий симметричный треугольник». Нижняя граница фигуры имеет координаты 0.8813/0.8844, при этом верхняя граница 0.8874/0.8844. Формирование фигуры «Бычий симметричный треугольник» наиболее вероятным образом свидетельствует
Таймфреймы М5 и М15 могут иметь больше ложных точек входа.
Открыть график инструмента в новом окне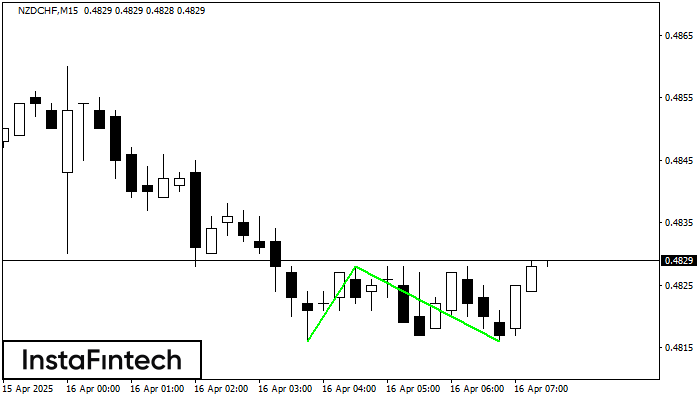
Сформирована фигура «Двойное дно» на графике NZDCHF M15. Верхняя граница 0.4828; Нижняя граница 0.4816; Ширина фигуры 12 пунктов. В случае пробоя верхней границы 0.4828 можно будет прогнозировать изменение тенденции
Таймфреймы М5 и М15 могут иметь больше ложных точек входа.
Открыть график инструмента в новом окне


