

signal strength 3 of 5
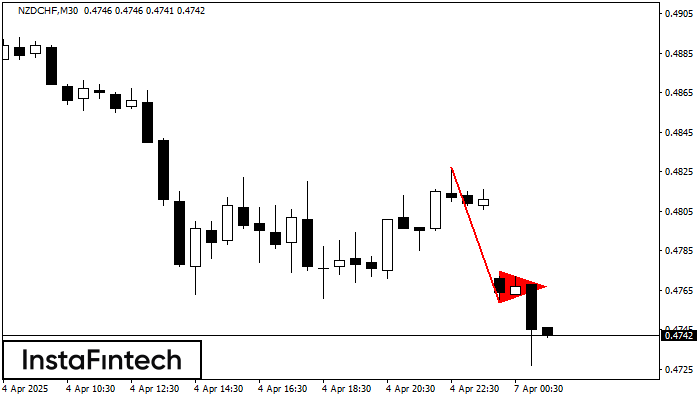
The Bearish pennant pattern has formed on the NZDCHF M30 chart. It signals potential continuation of the existing trend. Specifications: the pattern’s bottom has the coordinate of 0.4759; the projection of the flagpole height is equal to 68 pips. In case the price breaks out the pattern’s bottom of 0.4759, the downtrend is expected to continue for further level 0.4729.
- All
- Double Top
- Flag
- Head and Shoulders
- Pennant
- Rectangle
- Triangle
- Triple top
- All
- #AAPL
- #AMZN
- #Bitcoin
- #EBAY
- #FB
- #GOOG
- #INTC
- #KO
- #MA
- #MCD
- #MSFT
- #NTDOY
- #PEP
- #TSLA
- #TWTR
- AUDCAD
- AUDCHF
- AUDJPY
- AUDUSD
- EURCAD
- EURCHF
- EURGBP
- EURJPY
- EURNZD
- EURRUB
- EURUSD
- GBPAUD
- GBPCHF
- GBPJPY
- GBPUSD
- GOLD
- NZDCAD
- NZDCHF
- NZDJPY
- NZDUSD
- SILVER
- USDCAD
- USDCHF
- USDJPY
- USDRUB
- All
- M5
- M15
- M30
- H1
- D1
- All
- Buy
- Sale
- All
- 1
- 2
- 3
- 4
- 5

डबल बॉटम पैटर्न #Bitcoin M15 पर बना है। यह फॉर्मेशन नीचे से ऊपर की ओर प्रवृत्ति के उलट होने का संकेत देता है। संकेत यह है कि पैटर्न 96350.17 की
M5 और M15 समय सीमा में अधिक फाल्स एंट्री पॉइंट्स हो सकते हैं।
Open chart in a new window
डबल बॉटम पैटर्न #Bitcoin M30 पर बना है; ऊपरी सीमा 97860.25 है; निचली सीमा 96258.44 है। पैटर्न की चौड़ाई 156618 अंक है। ऊपरी सीमा 97860.25 के टूटने के मामले में
Open chart in a new window
डबल बॉटम पैटर्न #Bitcoin M5 पर बना है; ऊपरी सीमा 96467.62 है; निचली सीमा 96258.44 है। पैटर्न की चौड़ाई 20692 अंक है। ऊपरी सीमा 96467.62 के टूटने के मामले में
M5 और M15 समय सीमा में अधिक फाल्स एंट्री पॉइंट्स हो सकते हैं।
Open chart in a new window


