

signal strength 2 of 5

The Bearish Flag pattern has been formed on the chart AUDJPY M15 which signals that the downward trend will continue. If the price breaks below the low at 90.01, then it is most likely to move further downwards. The price will likely move by the number of points which equals the length of the flag pole (15 points).
The M5 and M15 time frames may have more false entry points.
See Also
- All
- Double Top
- Flag
- Head and Shoulders
- Pennant
- Rectangle
- Triangle
- Triple top
- All
- #AAPL
- #AMZN
- #Bitcoin
- #EBAY
- #FB
- #GOOG
- #INTC
- #KO
- #MA
- #MCD
- #MSFT
- #NTDOY
- #PEP
- #TSLA
- #TWTR
- AUDCAD
- AUDCHF
- AUDJPY
- AUDUSD
- EURCAD
- EURCHF
- EURGBP
- EURJPY
- EURNZD
- EURRUB
- EURUSD
- GBPAUD
- GBPCHF
- GBPJPY
- GBPUSD
- GOLD
- NZDCAD
- NZDCHF
- NZDJPY
- NZDUSD
- SILVER
- USDCAD
- USDCHF
- USDJPY
- USDRUB
- All
- M5
- M15
- M30
- H1
- D1
- All
- Buy
- Sale
- All
- 1
- 2
- 3
- 4
- 5
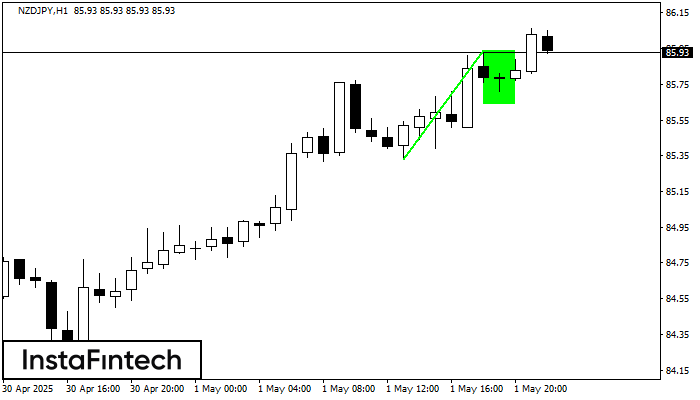
El patrón Bandera alcista que señala la continuación de una tendencia ha sido formado en el gráfico NZDJPY H1. Pronóstico: si el precio rompe por encima del alza del patrón
Open chart in a new window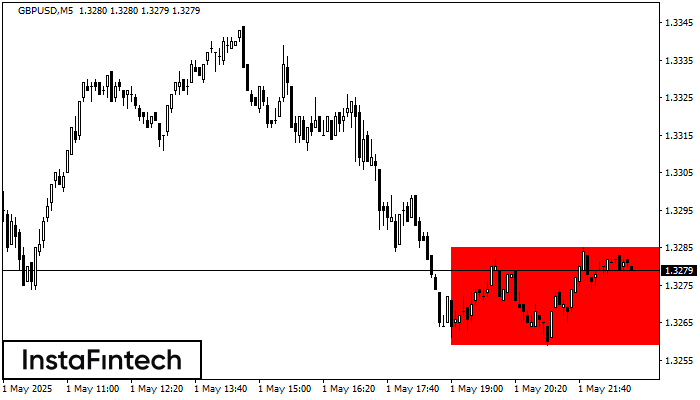
Según el gráfico de M5, GBPUSD formó el Rectángulo Bajista. Este tipo de patrón indica la continuación de una tendencia. Esto consiste de dos niveles: resistencia 1.3285 - 0.0000
Los marcos de tiempo M5 y M15 pueden tener más puntos de entrada falsos.
Open chart in a new window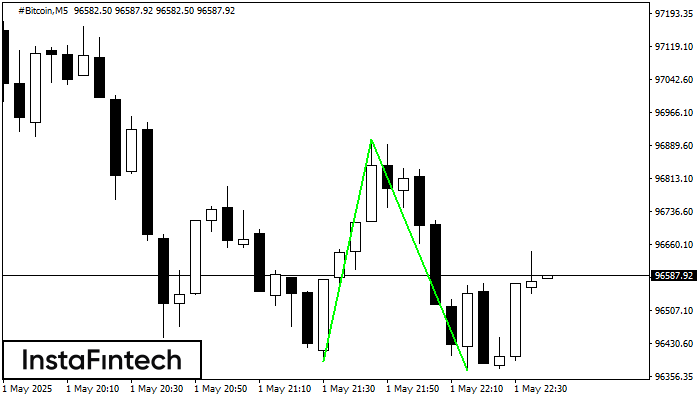
El patrón Doble Piso ha sido formado en #Bitcoin M5. Esta formación señala una reversión de la tendencia de bajista a alcista. La señal es que se debe abrir
Los marcos de tiempo M5 y M15 pueden tener más puntos de entrada falsos.
Open chart in a new window


