

signal strength 2 of 5
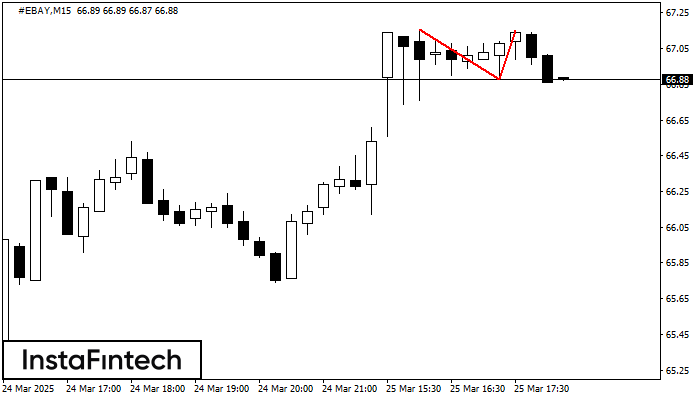
On the chart of #EBAY M15 the Double Top reversal pattern has been formed. Characteristics: the upper boundary 67.15; the lower boundary 66.88; the width of the pattern 27 points. The signal: a break of the lower boundary will cause continuation of the downward trend targeting the 66.65 level.
The M5 and M15 time frames may have more false entry points.
See Also
- All
- Double Top
- Flag
- Head and Shoulders
- Pennant
- Rectangle
- Triangle
- Triple top
- All
- #AAPL
- #AMZN
- #Bitcoin
- #EBAY
- #FB
- #GOOG
- #INTC
- #KO
- #MA
- #MCD
- #MSFT
- #NTDOY
- #PEP
- #TSLA
- #TWTR
- AUDCAD
- AUDCHF
- AUDJPY
- AUDUSD
- EURCAD
- EURCHF
- EURGBP
- EURJPY
- EURNZD
- EURRUB
- EURUSD
- GBPAUD
- GBPCHF
- GBPJPY
- GBPUSD
- GOLD
- NZDCAD
- NZDCHF
- NZDJPY
- NZDUSD
- SILVER
- USDCAD
- USDCHF
- USDJPY
- USDRUB
- All
- M5
- M15
- M30
- H1
- D1
- All
- Buy
- Sale
- All
- 1
- 2
- 3
- 4
- 5
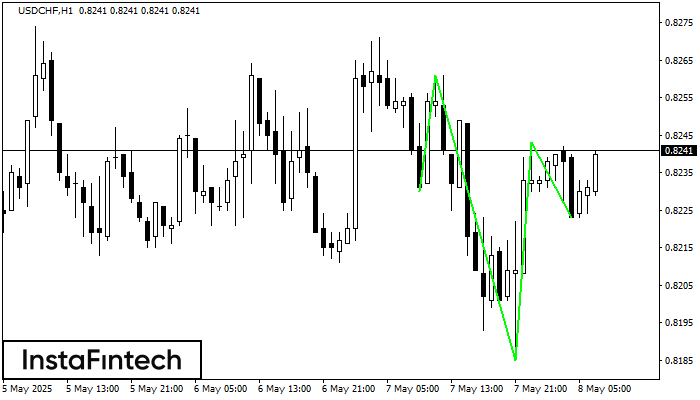
According to the chart of H1, USDCHF formed the Inverse Head and Shoulder pattern. The Head’s top is set at 0.8243 while the median line of the Neck is found
Open chart in a new window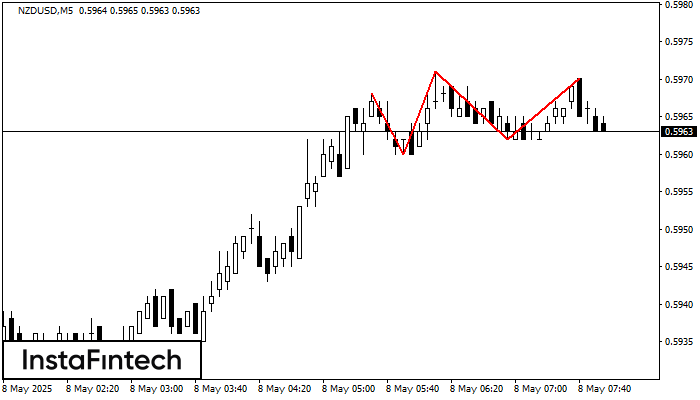
The Triple Top pattern has formed on the chart of the NZDUSD M5 trading instrument. It is a reversal pattern featuring the following characteristics: resistance level -2, support level -2
The M5 and M15 time frames may have more false entry points.
Open chart in a new window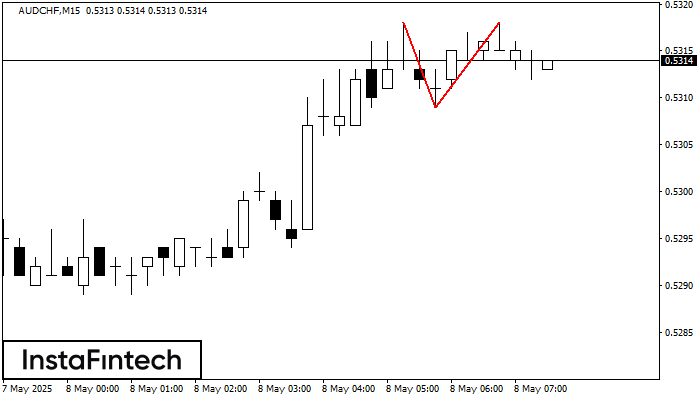
On the chart of AUDCHF M15 the Double Top reversal pattern has been formed. Characteristics: the upper boundary 0.5318; the lower boundary 0.5309; the width of the pattern 9 points
The M5 and M15 time frames may have more false entry points.
Open chart in a new window


