

signal strength 3 of 5
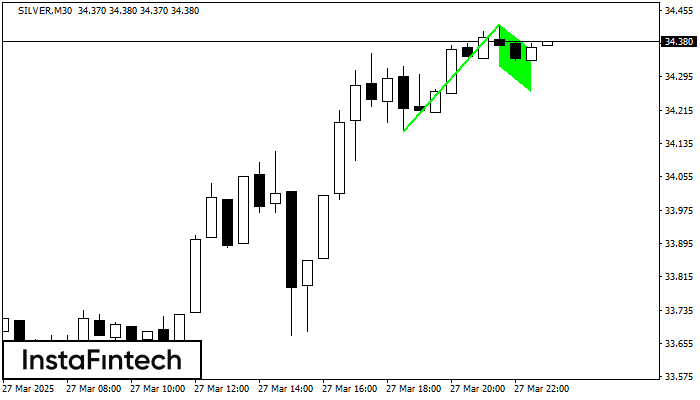
The Bullish Flag pattern has been formed on SILVER at M30. The lower boundary of the pattern is located at 34.32/34.26, while the higher boundary lies at 34.42/34.36. The projection of the flagpole is 255 points. This formation signals that the upward trend is most likely to continue. Therefore, if the level of 34.42 is broken, the price will move further upwards.
- All
- Double Top
- Flag
- Head and Shoulders
- Pennant
- Rectangle
- Triangle
- Triple top
- All
- #AAPL
- #AMZN
- #Bitcoin
- #EBAY
- #FB
- #GOOG
- #INTC
- #KO
- #MA
- #MCD
- #MSFT
- #NTDOY
- #PEP
- #TSLA
- #TWTR
- AUDCAD
- AUDCHF
- AUDJPY
- AUDUSD
- EURCAD
- EURCHF
- EURGBP
- EURJPY
- EURNZD
- EURRUB
- EURUSD
- GBPAUD
- GBPCHF
- GBPJPY
- GBPUSD
- GOLD
- NZDCAD
- NZDCHF
- NZDJPY
- NZDUSD
- SILVER
- USDCAD
- USDCHF
- USDJPY
- USDRUB
- All
- M5
- M15
- M30
- H1
- D1
- All
- Buy
- Sale
- All
- 1
- 2
- 3
- 4
- 5
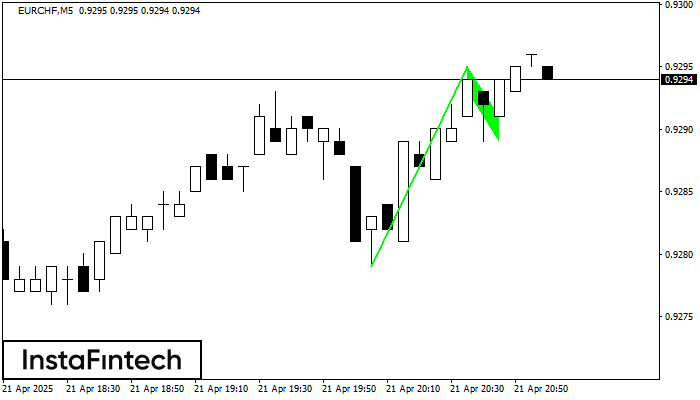
Corak Flag Aliran Menaik telah dibentuk pada carta EURCHF M5 yang memberi isyarat bahawa aliran menaik akan berterusan. Isyarat: penembusan bahagian atas pada 0.9295 boleh menolak harga yang lebih tinggi
Carta masa M5 dan M15 mungkin mempunyai lebih banyak titik kemasukan palsu.
Open chart in a new window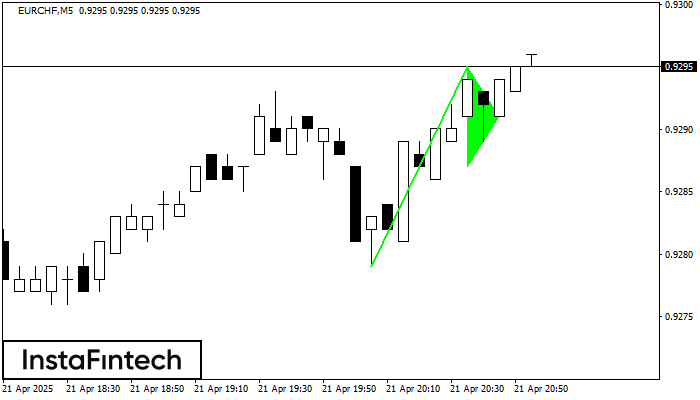
Corak Pennant Aliran Menaik adalah dibentuk pada carta EURCHF M5. Ia adalah jenis corak kesinambungan. Seandainya, sekiranya harga adalah tetap di atas paras tinggi Pennant 0.9295, arah aliran menaik selanjutnya
Carta masa M5 dan M15 mungkin mempunyai lebih banyak titik kemasukan palsu.
Open chart in a new window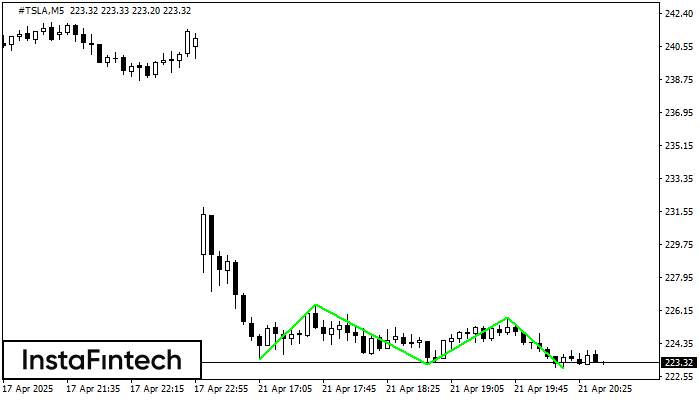
Corak Triple Bottom telah dibentuk pada carta bagi instrumen dagangan #TSLA M5. Corak menandakan perubahan aliran dari menurun ke aliran menaik dalam sekiranya penembusan 226.48/225.78
Carta masa M5 dan M15 mungkin mempunyai lebih banyak titik kemasukan palsu.
Open chart in a new window


