

signal strength 2 of 5
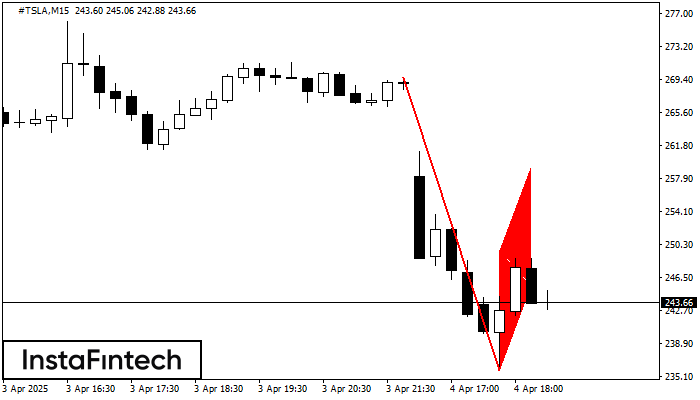
The Bearish Flag pattern has been formed on the chart #TSLA M15. Therefore, the downwards trend is likely to continue in the nearest term. As soon as the price breaks below the low at 235.81, traders should enter the market.
The M5 and M15 time frames may have more false entry points.
- All
- Double Top
- Flag
- Head and Shoulders
- Pennant
- Rectangle
- Triangle
- Triple top
- All
- #AAPL
- #AMZN
- #Bitcoin
- #EBAY
- #FB
- #GOOG
- #INTC
- #KO
- #MA
- #MCD
- #MSFT
- #NTDOY
- #PEP
- #TSLA
- #TWTR
- AUDCAD
- AUDCHF
- AUDJPY
- AUDUSD
- EURCAD
- EURCHF
- EURGBP
- EURJPY
- EURNZD
- EURRUB
- EURUSD
- GBPAUD
- GBPCHF
- GBPJPY
- GBPUSD
- GOLD
- NZDCAD
- NZDCHF
- NZDJPY
- NZDUSD
- SILVER
- USDCAD
- USDCHF
- USDJPY
- USDRUB
- All
- M5
- M15
- M30
- H1
- D1
- All
- Buy
- Sale
- All
- 1
- 2
- 3
- 4
- 5
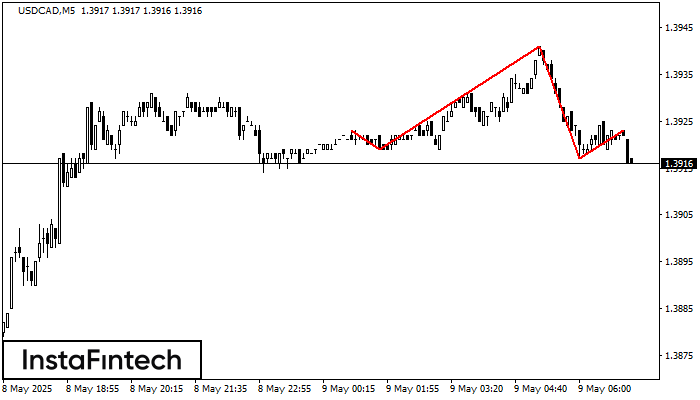
The USDCAD M5 formed the Head and Shoulders pattern with the following features: The Head’s top is at 1.3941, the Neckline and the upward angle are at 1.3919/1.3917. The formation
The M5 and M15 time frames may have more false entry points.
Open chart in a new window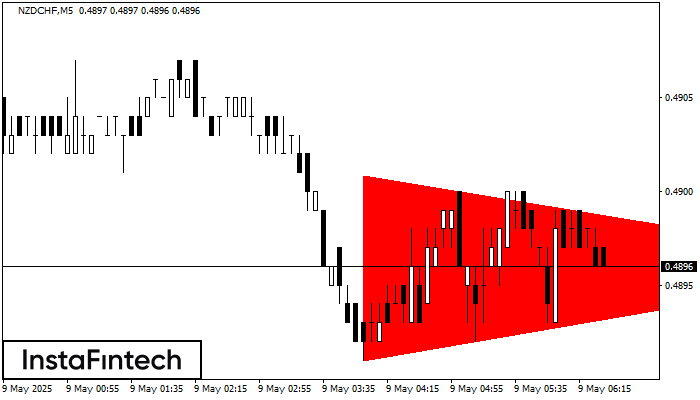
According to the chart of M5, NZDCHF formed the Bearish Symmetrical Triangle pattern. Description: The lower border is 0.4891/0.4896 and upper border is 0.4901/0.4896. The pattern width is measured
The M5 and M15 time frames may have more false entry points.
Open chart in a new window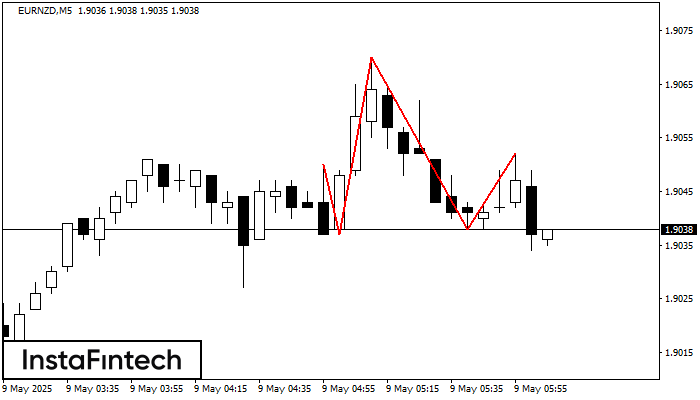
The EURNZD M5 formed the Head and Shoulders pattern with the following features: The Head’s top is at 1.9070, the Neckline and the upward angle are at 1.9037/1.9038. The formation
The M5 and M15 time frames may have more false entry points.
Open chart in a new window


