

signal strength 1 of 5
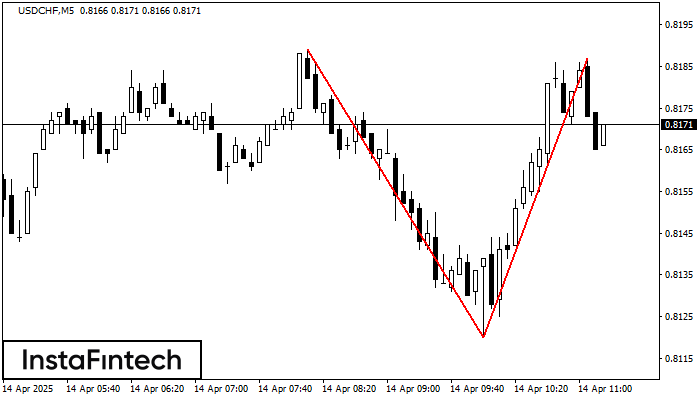
The Double Top reversal pattern has been formed on USDCHF M5. Characteristics: the upper boundary 0.8189; the lower boundary 0.8120; the width of the pattern is 67 points. Sell trades are better to be opened below the lower boundary 0.8120 with a possible movements towards the 0.8105 level.
The M5 and M15 time frames may have more false entry points.
See Also
- All
- Double Top
- Flag
- Head and Shoulders
- Pennant
- Rectangle
- Triangle
- Triple top
- All
- #AAPL
- #AMZN
- #Bitcoin
- #EBAY
- #FB
- #GOOG
- #INTC
- #KO
- #MA
- #MCD
- #MSFT
- #NTDOY
- #PEP
- #TSLA
- #TWTR
- AUDCAD
- AUDCHF
- AUDJPY
- AUDUSD
- EURCAD
- EURCHF
- EURGBP
- EURJPY
- EURNZD
- EURRUB
- EURUSD
- GBPAUD
- GBPCHF
- GBPJPY
- GBPUSD
- GOLD
- NZDCAD
- NZDCHF
- NZDJPY
- NZDUSD
- SILVER
- USDCAD
- USDCHF
- USDJPY
- USDRUB
- All
- M5
- M15
- M30
- H1
- D1
- All
- Buy
- Sale
- All
- 1
- 2
- 3
- 4
- 5
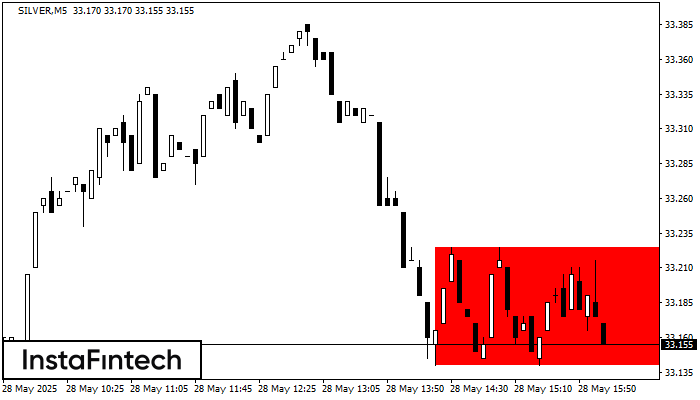
According to the chart of M5, SILVER formed the Bearish Rectangle. The pattern indicates a trend continuation. The upper border is 33.23, the lower border is 33.14. The signal means
The M5 and M15 time frames may have more false entry points.
Open chart in a new window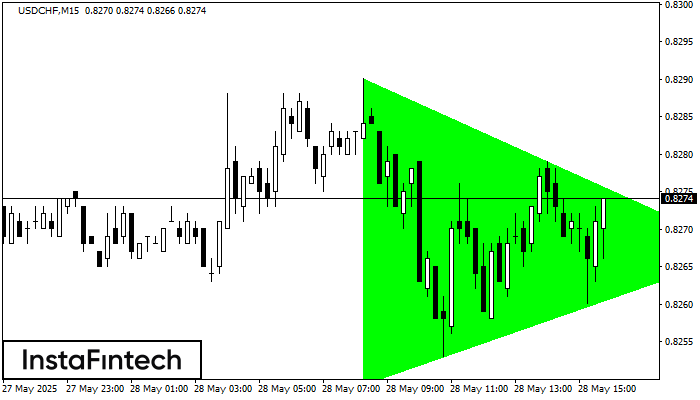
According to the chart of M15, USDCHF formed the Bullish Symmetrical Triangle pattern, which signals the trend will continue. Description. The upper border of the pattern touches the coordinates 0.8290/0.8267
The M5 and M15 time frames may have more false entry points.
Open chart in a new window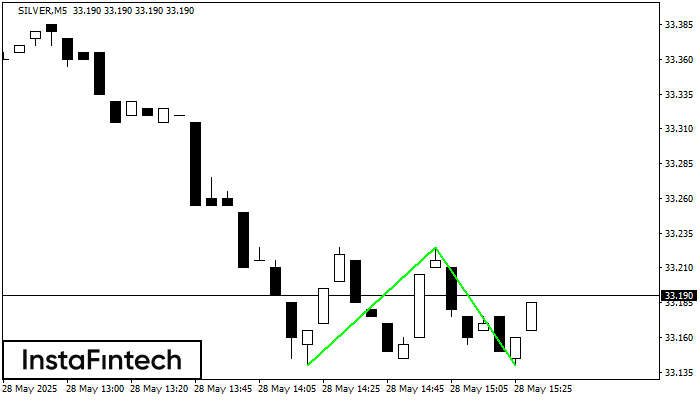
The Double Bottom pattern has been formed on SILVER M5. Characteristics: the support level 33.14; the resistance level 33.23; the width of the pattern 85 points. If the resistance level
The M5 and M15 time frames may have more false entry points.
Open chart in a new window


