сила сигнала 2 из 5
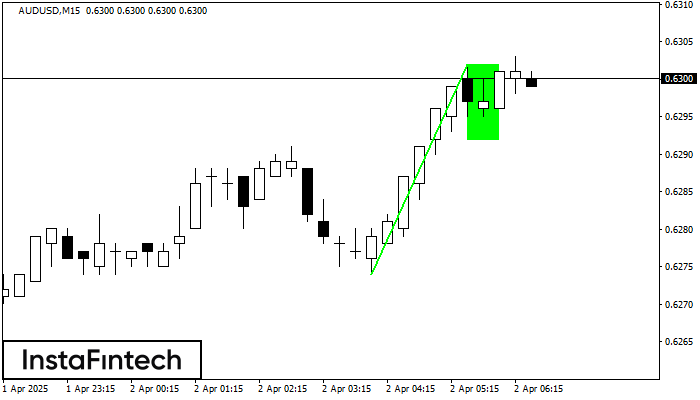
На графике AUDUSD M15 сформировалась фигура «Бычий флаг», которая сигнализирует о продолжении восходящего тренда. Сигналы: Пробой максимума фигуры 0.6302 может привести к продолжению восходящего движения, где рост инструмента будет являться проекцией высоты флагштока.
Таймфреймы М5 и М15 могут иметь больше ложных точек входа.
Смотрите также
- Все
- Вымпел
- Голова и плечи
- Двойная вершина
- Прямоугольник
- Треугольник
- Тройная вершина
- Флаг
- Все
- #AAPL
- #AMZN
- #Bitcoin
- #EBAY
- #FB
- #GOOG
- #INTC
- #KO
- #MA
- #MCD
- #MSFT
- #NTDOY
- #PEP
- #TSLA
- #TWTR
- AUDCAD
- AUDCHF
- AUDJPY
- AUDUSD
- EURCAD
- EURCHF
- EURGBP
- EURJPY
- EURNZD
- EURRUB
- EURUSD
- GBPAUD
- GBPCHF
- GBPJPY
- GBPUSD
- GOLD
- NZDCAD
- NZDCHF
- NZDJPY
- NZDUSD
- SILVER
- USDCAD
- USDCHF
- USDJPY
- USDRUB
- Все
- M5
- M15
- M30
- H1
- D1
- Все
- Покупка
- Продажа
- Все
- 1
- 2
- 3
- 4
- 5
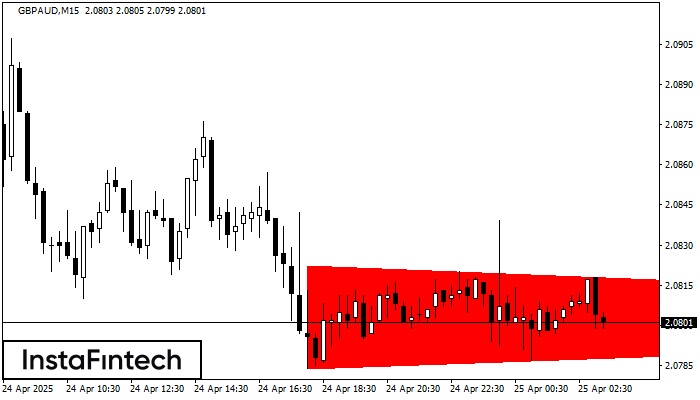
According to the chart of M15, GBPAUD formed the Bearish Symmetrical Triangle pattern. Description: The lower border is 2.0784/2.0802 and upper border is 2.0822/2.0802. The pattern width is measured
The M5 and M15 time frames may have more false entry points.
Open chart in a new window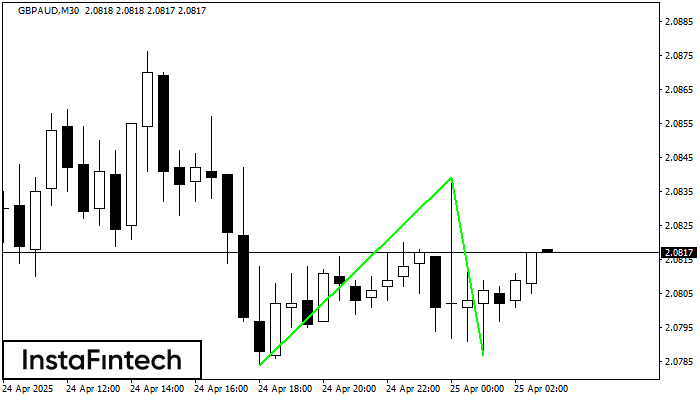
The Double Bottom pattern has been formed on GBPAUD M30. Characteristics: the support level 2.0784; the resistance level 2.0839; the width of the pattern 55 points. If the resistance level
Open chart in a new window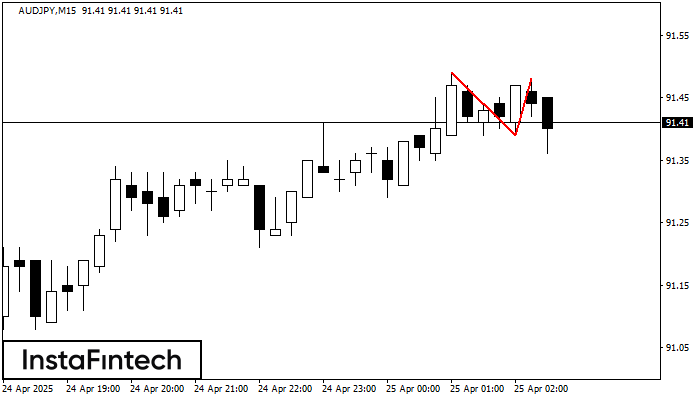
On the chart of AUDJPY M15 the Double Top reversal pattern has been formed. Characteristics: the upper boundary 91.48; the lower boundary 91.39; the width of the pattern 9 points
The M5 and M15 time frames may have more false entry points.
Open chart in a new window