

signal strength 2 of 5
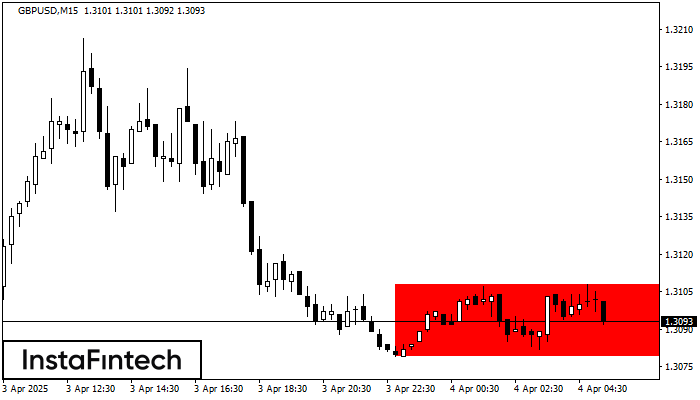
According to the chart of M15, GBPUSD formed the Bearish Rectangle. The pattern indicates a trend continuation. The upper border is 1.3108, the lower border is 1.3079. The signal means that a short position should be opened after fixing a price below the lower border 1.3079 of the Bearish Rectangle.
The M5 and M15 time frames may have more false entry points.
- All
- Double Top
- Flag
- Head and Shoulders
- Pennant
- Rectangle
- Triangle
- Triple top
- All
- #AAPL
- #AMZN
- #Bitcoin
- #EBAY
- #FB
- #GOOG
- #INTC
- #KO
- #MA
- #MCD
- #MSFT
- #NTDOY
- #PEP
- #TSLA
- #TWTR
- AUDCAD
- AUDCHF
- AUDJPY
- AUDUSD
- EURCAD
- EURCHF
- EURGBP
- EURJPY
- EURNZD
- EURRUB
- EURUSD
- GBPAUD
- GBPCHF
- GBPJPY
- GBPUSD
- GOLD
- NZDCAD
- NZDCHF
- NZDJPY
- NZDUSD
- SILVER
- USDCAD
- USDCHF
- USDJPY
- USDRUB
- All
- M5
- M15
- M30
- H1
- D1
- All
- Buy
- Sale
- All
- 1
- 2
- 3
- 4
- 5
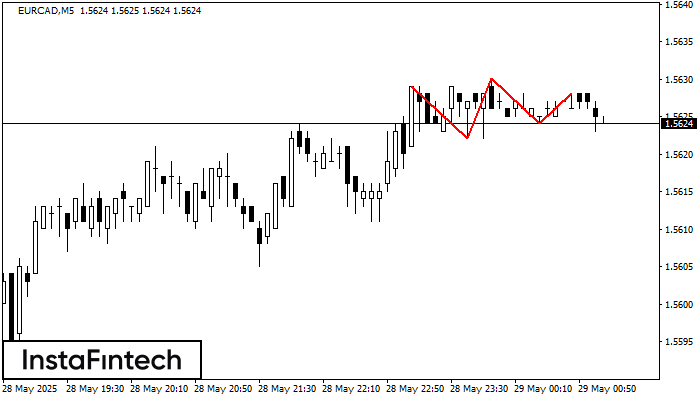
Corak Triple Top telah dibentuk pada carta bagi instrumen dagangan EURCAD M5. Ia adalah corak pembalikan yang memaparkan ciri-ciri berikut: tahap rintangan 1, tahap sokongan -2, dan lebar corak
Carta masa M5 dan M15 mungkin mempunyai lebih banyak titik kemasukan palsu.
Open chart in a new window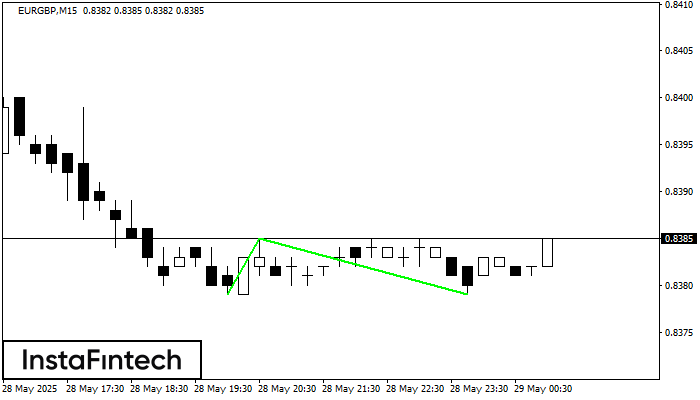
Corak Double Bottom telah dibentuk pada EURGBP M15. Pembentukan ini menandakan pembalikan aliran dari aliran menurun ke atas. Isyarat ialah perdagangan membeli harus dibuka selepas sempadan atas corak 0.8385 telah
Carta masa M5 dan M15 mungkin mempunyai lebih banyak titik kemasukan palsu.
Open chart in a new window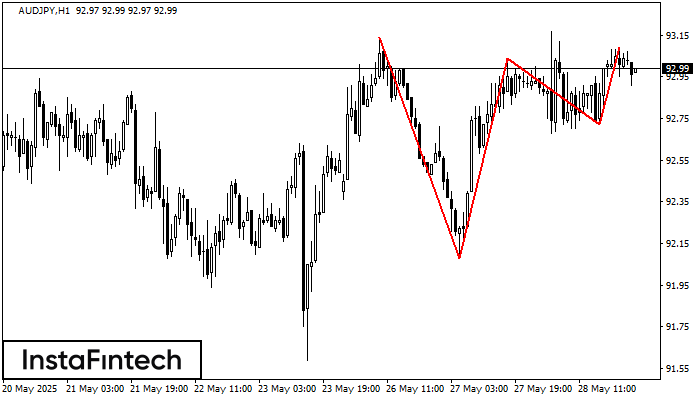
Corak Triple Top telah dibentuk pada carta bagi instrumen dagangan AUDJPY H1. Ia adalah corak pembalikan yang memaparkan ciri-ciri berikut: tahap rintangan 5, tahap sokongan -64, dan lebar corak
Open chart in a new window


