

signal strength 1 of 5
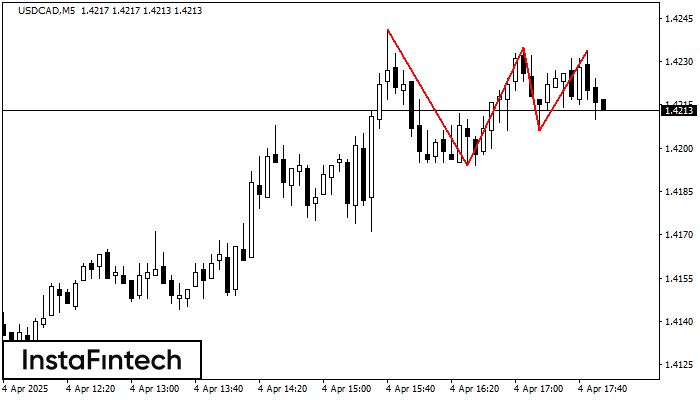
On the chart of the USDCAD M5 trading instrument, the Triple Top pattern that signals a trend change has formed. It is possible that after formation of the third peak, the price will try to break through the resistance level 1.4194, where we advise to open a trading position for sale. Take profit is the projection of the pattern’s width, which is 47 points.
The M5 and M15 time frames may have more false entry points.
- All
- Double Top
- Flag
- Head and Shoulders
- Pennant
- Rectangle
- Triangle
- Triple top
- All
- #AAPL
- #AMZN
- #Bitcoin
- #EBAY
- #FB
- #GOOG
- #INTC
- #KO
- #MA
- #MCD
- #MSFT
- #NTDOY
- #PEP
- #TSLA
- #TWTR
- AUDCAD
- AUDCHF
- AUDJPY
- AUDUSD
- EURCAD
- EURCHF
- EURGBP
- EURJPY
- EURNZD
- EURRUB
- EURUSD
- GBPAUD
- GBPCHF
- GBPJPY
- GBPUSD
- GOLD
- NZDCAD
- NZDCHF
- NZDJPY
- NZDUSD
- SILVER
- USDCAD
- USDCHF
- USDJPY
- USDRUB
- All
- M5
- M15
- M30
- H1
- D1
- All
- Buy
- Sale
- All
- 1
- 2
- 3
- 4
- 5
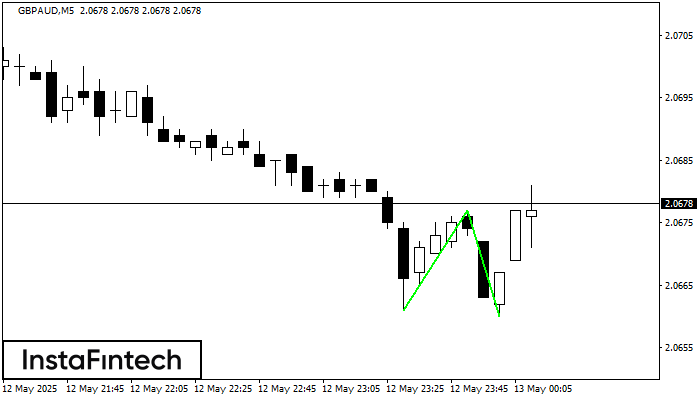
Corak Double Bottom telah dibentuk pada GBPAUD M5; sempadan atas adalah 2.0677; sempadan bawah adalah 2.0660. Lebar corak adalah 16 mata. Sekiranya penembusan sempadan atas 2.0677, perubahan aliran boleh diramalkan
Carta masa M5 dan M15 mungkin mempunyai lebih banyak titik kemasukan palsu.
Open chart in a new window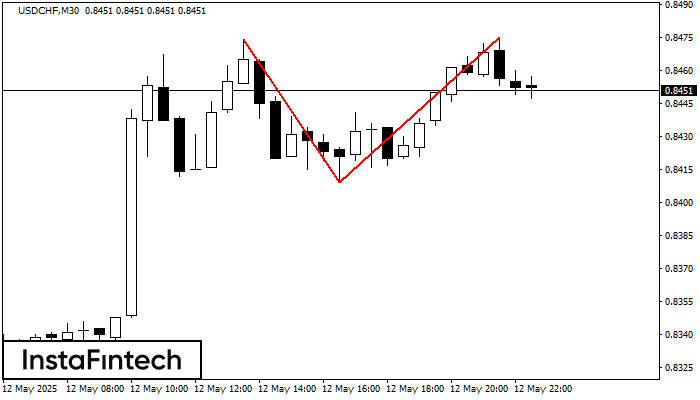
Pada carta USDCHF M30 corak pembalikan Double Top telah terbentuk. Ciri-ciri: sempadan atas 0.8475; sempadan bawah 0.8409; lebar corak 66 mata. Isyarat: penembusan sempadan bawah akan menyebabkan kesinambungan arah aliran
Open chart in a new window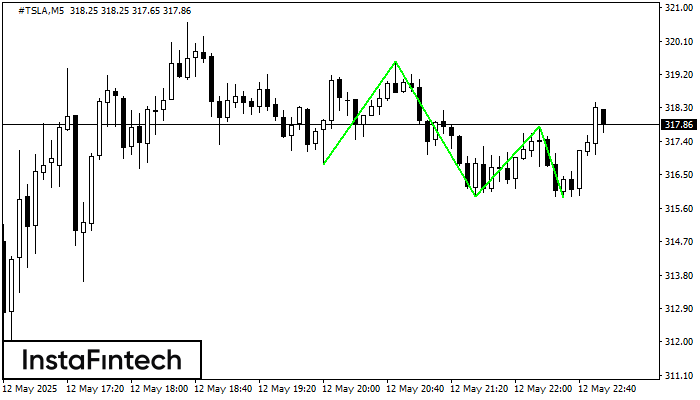
Corak Triple Bottom telah dibentuk pada #TSLA M5. Ia mempunyai ciri-ciri berikut: tahap rintangan 319.55/317.80; tahap sokongan 316.79/315.89; lebar corak adalah 276 mata. Dalam situasi penembusan paras rintangan 319.55, harga
Carta masa M5 dan M15 mungkin mempunyai lebih banyak titik kemasukan palsu.
Open chart in a new window


