


signal strength 1 of 5
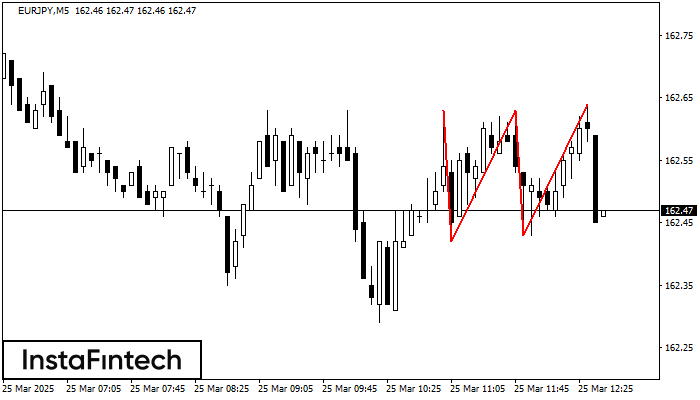
On the chart of the EURJPY M5 trading instrument, the Triple Top pattern that signals a trend change has formed. It is possible that after formation of the third peak, the price will try to break through the resistance level 162.42, where we advise to open a trading position for sale. Take profit is the projection of the pattern’s width, which is 21 points.
The M5 and M15 time frames may have more false entry points.
- All
- Double Top
- Flag
- Head and Shoulders
- Pennant
- Rectangle
- Triangle
- Triple top
- All
- #AAPL
- #AMZN
- #Bitcoin
- #EBAY
- #FB
- #GOOG
- #INTC
- #KO
- #MA
- #MCD
- #MSFT
- #NTDOY
- #PEP
- #TSLA
- #TWTR
- AUDCAD
- AUDCHF
- AUDJPY
- AUDUSD
- EURCAD
- EURCHF
- EURGBP
- EURJPY
- EURNZD
- EURRUB
- EURUSD
- GBPAUD
- GBPCHF
- GBPJPY
- GBPUSD
- GOLD
- NZDCAD
- NZDCHF
- NZDJPY
- NZDUSD
- SILVER
- USDCAD
- USDCHF
- USDJPY
- USDRUB
- All
- M5
- M15
- M30
- H1
- D1
- All
- Buy
- Sale
- All
- 1
- 2
- 3
- 4
- 5
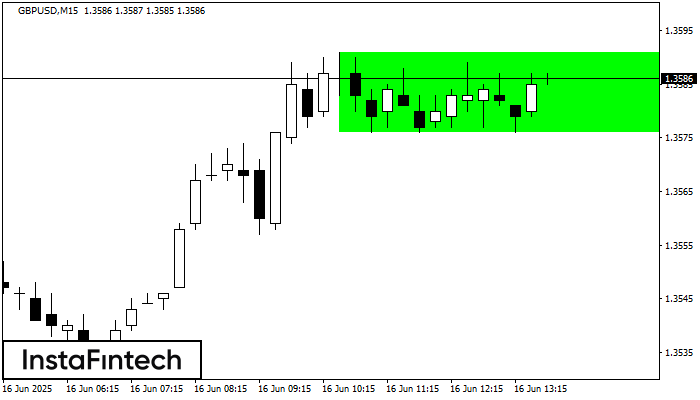
According to the chart of M15, GBPUSD formed the Bullish Rectangle. This type of a pattern indicates a trend continuation. It consists of two levels: resistance 1.3591 and support 1.3576
The M5 and M15 time frames may have more false entry points.
Open chart in a new window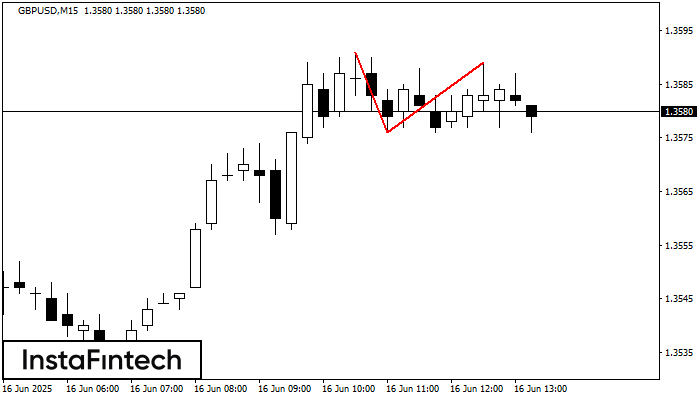
On the chart of GBPUSD M15 the Double Top reversal pattern has been formed. Characteristics: the upper boundary 1.3589; the lower boundary 1.3576; the width of the pattern 13 points
The M5 and M15 time frames may have more false entry points.
Open chart in a new window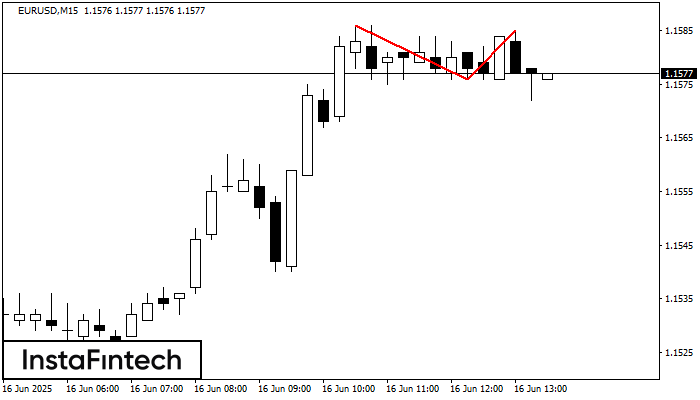
The Double Top reversal pattern has been formed on EURUSD M15. Characteristics: the upper boundary 1.1586; the lower boundary 1.1576; the width of the pattern is 9 points. Sell trades
The M5 and M15 time frames may have more false entry points.
Open chart in a new window


