


signal strength 1 of 5
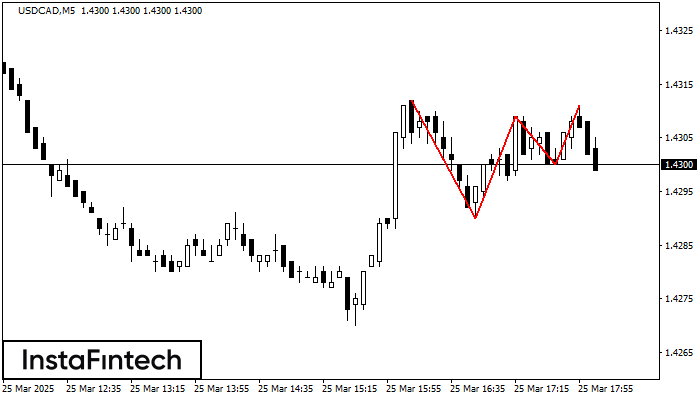
The Triple Top pattern has formed on the chart of the USDCAD M5 trading instrument. It is a reversal pattern featuring the following characteristics: resistance level 1, support level -10, and pattern’s width 22. Forecast If the price breaks through the support level 1.4290, it is likely to move further down to 1.4294.
The M5 and M15 time frames may have more false entry points.
See Also
- All
- Double Top
- Flag
- Head and Shoulders
- Pennant
- Rectangle
- Triangle
- Triple top
- All
- #AAPL
- #AMZN
- #Bitcoin
- #EBAY
- #FB
- #GOOG
- #INTC
- #KO
- #MA
- #MCD
- #MSFT
- #NTDOY
- #PEP
- #TSLA
- #TWTR
- AUDCAD
- AUDCHF
- AUDJPY
- AUDUSD
- EURCAD
- EURCHF
- EURGBP
- EURJPY
- EURNZD
- EURRUB
- EURUSD
- GBPAUD
- GBPCHF
- GBPJPY
- GBPUSD
- GOLD
- NZDCAD
- NZDCHF
- NZDJPY
- NZDUSD
- SILVER
- USDCAD
- USDCHF
- USDJPY
- USDRUB
- All
- M5
- M15
- M30
- H1
- D1
- All
- Buy
- Sale
- All
- 1
- 2
- 3
- 4
- 5

The Bearish pennant pattern has formed on the #TSLA M5 chart. The pattern signals continuation of the downtrend in case the pennant’s low of 288.55 is broken through. Recommendations: Place
The M5 and M15 time frames may have more false entry points.
Open chart in a new window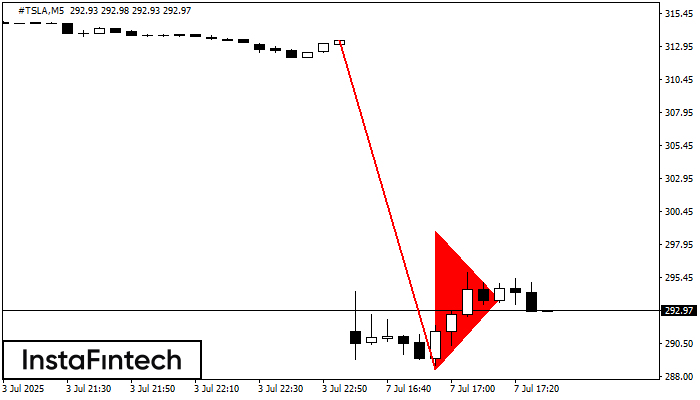
The Bearish pennant pattern has formed on the #TSLA M5 chart. The pattern signals continuation of the downtrend in case the pennant’s low of 288.55 is broken through. Recommendations: Place
The M5 and M15 time frames may have more false entry points.
Open chart in a new window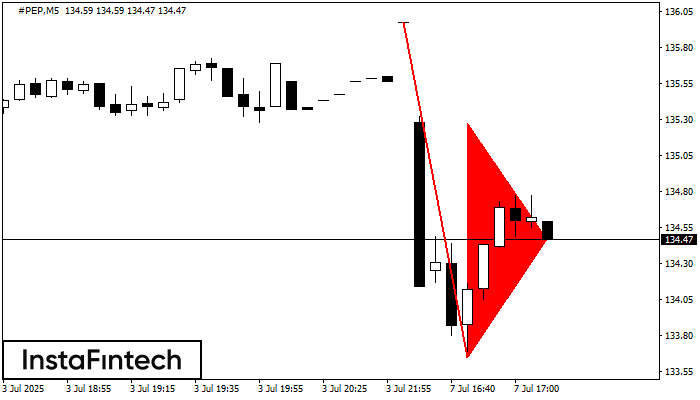
The Bearish pennant pattern has formed on the #PEP M5 chart. It signals potential continuation of the existing trend. Specifications: the pattern’s bottom has the coordinate of 133.65; the projection
The M5 and M15 time frames may have more false entry points.
Open chart in a new window


