

signal strength 2 of 5
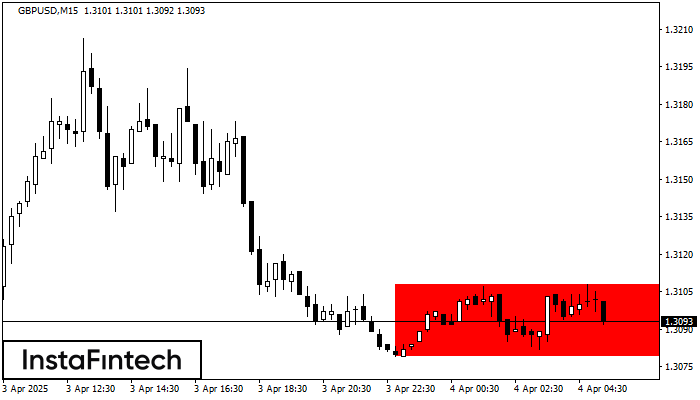
According to the chart of M15, GBPUSD formed the Bearish Rectangle. The pattern indicates a trend continuation. The upper border is 1.3108, the lower border is 1.3079. The signal means that a short position should be opened after fixing a price below the lower border 1.3079 of the Bearish Rectangle.
The M5 and M15 time frames may have more false entry points.
- All
- Double Top
- Flag
- Head and Shoulders
- Pennant
- Rectangle
- Triangle
- Triple top
- All
- #AAPL
- #AMZN
- #Bitcoin
- #EBAY
- #FB
- #GOOG
- #INTC
- #KO
- #MA
- #MCD
- #MSFT
- #NTDOY
- #PEP
- #TSLA
- #TWTR
- AUDCAD
- AUDCHF
- AUDJPY
- AUDUSD
- EURCAD
- EURCHF
- EURGBP
- EURJPY
- EURNZD
- EURRUB
- EURUSD
- GBPAUD
- GBPCHF
- GBPJPY
- GBPUSD
- GOLD
- NZDCAD
- NZDCHF
- NZDJPY
- NZDUSD
- SILVER
- USDCAD
- USDCHF
- USDJPY
- USDRUB
- All
- M5
- M15
- M30
- H1
- D1
- All
- Buy
- Sale
- All
- 1
- 2
- 3
- 4
- 5
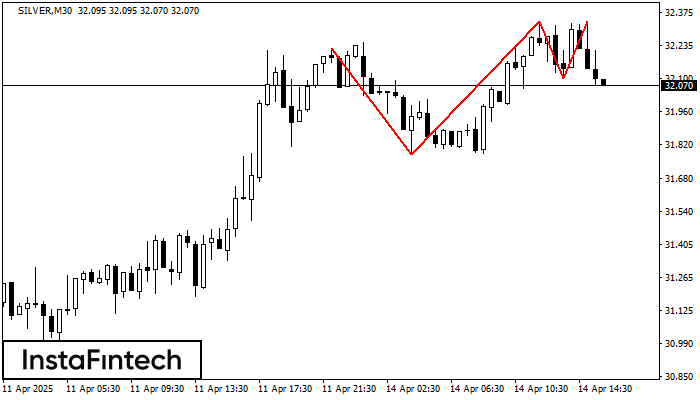
O padrão Topo triplo se formou no gráfico de SILVER M30. Características do padrão: os limites têm um ângulo ascendente; a linha inferior do padrão tem as coordenadas 31.78/32.10
Open chart in a new window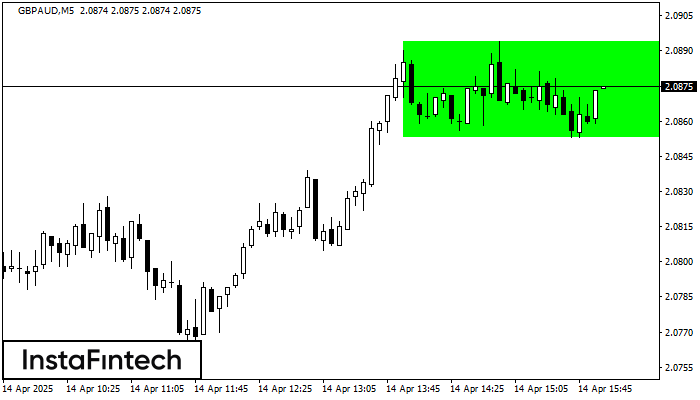
Conforme o gráfico de M5, GBPAUD formou o Retângulo de alta. Este tipo de padrão indica uma continuação da tendência. Ele consiste em dois níveis: resistência 2.0894 e suporte 2.0853
Os intervalos M5 e M15 podem ter mais pontos de entrada falsos.
Open chart in a new window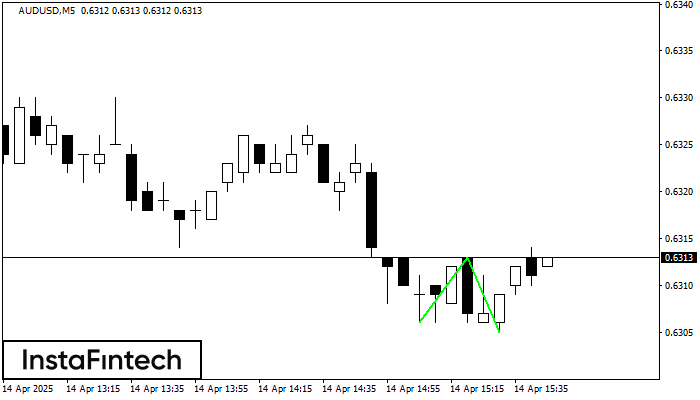
O padrão Fundo duplo foi formado em AUDUSD M5; o limite superior é 0.6313; o limite inferior é 0.6305. A largura do padrão é de 7 pontos. No caso
Os intervalos M5 e M15 podem ter mais pontos de entrada falsos.
Open chart in a new window


