

signal strength 2 of 5

The Bullish Flag pattern has been formed on GBPUSD at M15. The lower boundary of the pattern is located at 1.3255/1.3255, while the higher boundary lies at 1.3263/1.3263. The projection of the flagpole is 19 points. This formation signals that the upward trend is most likely to continue. Therefore, if the level of 1.3263 is broken, the price will move further upwards.
The M5 and M15 time frames may have more false entry points.
- All
- Double Top
- Flag
- Head and Shoulders
- Pennant
- Rectangle
- Triangle
- Triple top
- All
- #AAPL
- #AMZN
- #Bitcoin
- #EBAY
- #FB
- #GOOG
- #INTC
- #KO
- #MA
- #MCD
- #MSFT
- #NTDOY
- #PEP
- #TSLA
- #TWTR
- AUDCAD
- AUDCHF
- AUDJPY
- AUDUSD
- EURCAD
- EURCHF
- EURGBP
- EURJPY
- EURNZD
- EURRUB
- EURUSD
- GBPAUD
- GBPCHF
- GBPJPY
- GBPUSD
- GOLD
- NZDCAD
- NZDCHF
- NZDJPY
- NZDUSD
- SILVER
- USDCAD
- USDCHF
- USDJPY
- USDRUB
- All
- M5
- M15
- M30
- H1
- D1
- All
- Buy
- Sale
- All
- 1
- 2
- 3
- 4
- 5

The Double Bottom pattern has been formed on AUDCHF M30. This formation signals a reversal of the trend from downwards to upwards. The signal is that a buy trade should
Открыть график инструмента в новом окне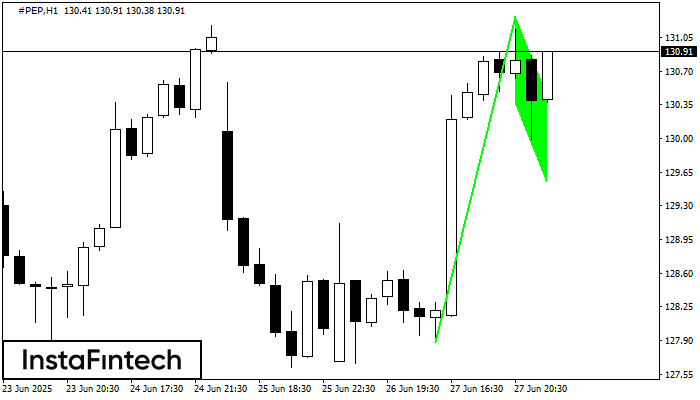
The Bullish Flag pattern has been formed on the chart #PEP H1 which signals that the upward trend will continue. Signals: а break of the peak at 131.27 may push
Открыть график инструмента в новом окне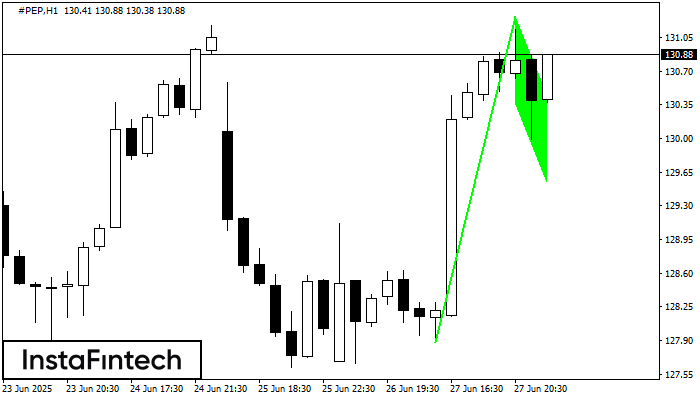
The Bullish Flag pattern has been formed on the chart #PEP H1 which signals that the upward trend will continue. Signals: а break of the peak at 131.27 may push
Открыть график инструмента в новом окне


