

сила сигнала 1 из 5
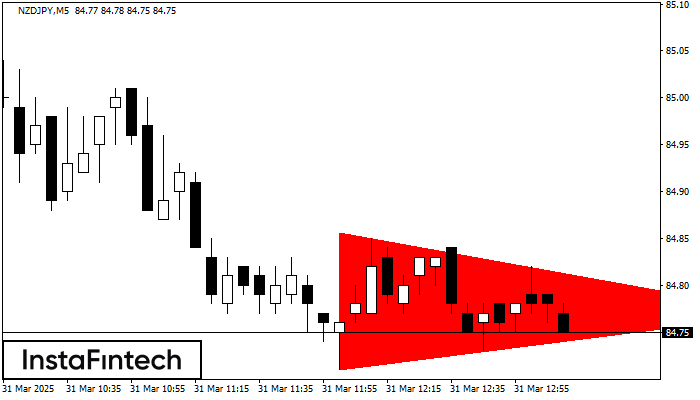
На графике NZDJPY на M5 сформировалась фигура «Медвежий симметричный треугольник». Торговые рекомендации: Пробой нижней границы 84.71 с большой долей вероятности приведет к продолжению нисходящего тренда.
Таймфреймы М5 и М15 могут иметь больше ложных точек входа.
- Все
- Вымпел
- Голова и плечи
- Двойная вершина
- Прямоугольник
- Треугольник
- Тройная вершина
- Флаг
- Все
- #AAPL
- #AMZN
- #Bitcoin
- #EBAY
- #FB
- #GOOG
- #INTC
- #KO
- #MA
- #MCD
- #MSFT
- #NTDOY
- #PEP
- #TSLA
- #TWTR
- AUDCAD
- AUDCHF
- AUDJPY
- AUDUSD
- EURCAD
- EURCHF
- EURGBP
- EURJPY
- EURNZD
- EURRUB
- EURUSD
- GBPAUD
- GBPCHF
- GBPJPY
- GBPUSD
- GOLD
- NZDCAD
- NZDCHF
- NZDJPY
- NZDUSD
- SILVER
- USDCAD
- USDCHF
- USDJPY
- USDRUB
- Все
- M5
- M15
- M30
- H1
- D1
- Все
- Покупка
- Продажа
- Все
- 1
- 2
- 3
- 4
- 5

According to the chart of M5, AUDCAD formed the Bullish Symmetrical Triangle pattern, which signals the trend will continue. Description. The upper border of the pattern touches the coordinates 0.8838/0.8828
The M5 and M15 time frames may have more false entry points.
Open chart in a new window
The Bullish pennant graphic pattern has formed on the GBPAUD M5 instrument. This pattern type falls under the category of continuation patterns. In this case, if the quote can breaks
The M5 and M15 time frames may have more false entry points.
Open chart in a new window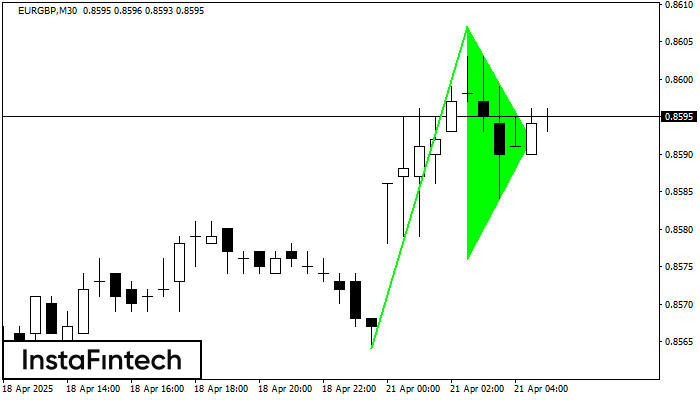
The Bullish pennant graphic pattern has formed on the EURGBP M30 instrument. This pattern type falls under the category of continuation patterns. In this case, if the quote can breaks
Open chart in a new window


