

signal strength 2 of 5
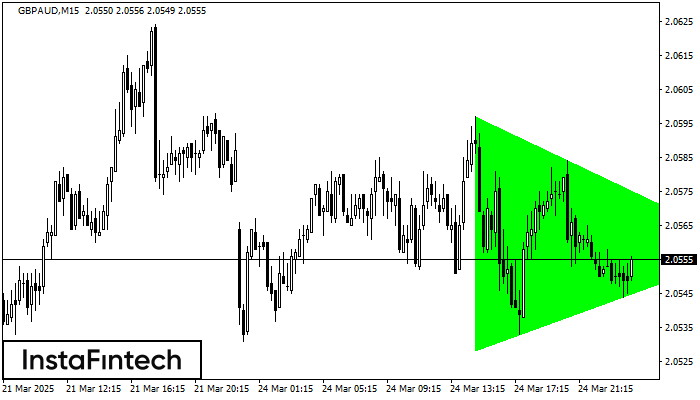
According to the chart of M15, GBPAUD formed the Bullish Symmetrical Triangle pattern. Description: This is the pattern of a trend continuation. 2.0597 and 2.0528 are the coordinates of the upper and lower borders respectively. The pattern width is measured on the chart at 69 pips. Outlook: If the upper border 2.0597 is broken, the price is likely to continue its move by 2.0580.
The M5 and M15 time frames may have more false entry points.
- All
- Double Top
- Flag
- Head and Shoulders
- Pennant
- Rectangle
- Triangle
- Triple top
- All
- #AAPL
- #AMZN
- #Bitcoin
- #EBAY
- #FB
- #GOOG
- #INTC
- #KO
- #MA
- #MCD
- #MSFT
- #NTDOY
- #PEP
- #TSLA
- #TWTR
- AUDCAD
- AUDCHF
- AUDJPY
- AUDUSD
- EURCAD
- EURCHF
- EURGBP
- EURJPY
- EURNZD
- EURRUB
- EURUSD
- GBPAUD
- GBPCHF
- GBPJPY
- GBPUSD
- GOLD
- NZDCAD
- NZDCHF
- NZDJPY
- NZDUSD
- SILVER
- USDCAD
- USDCHF
- USDJPY
- USDRUB
- All
- M5
- M15
- M30
- H1
- D1
- All
- Buy
- Sale
- All
- 1
- 2
- 3
- 4
- 5
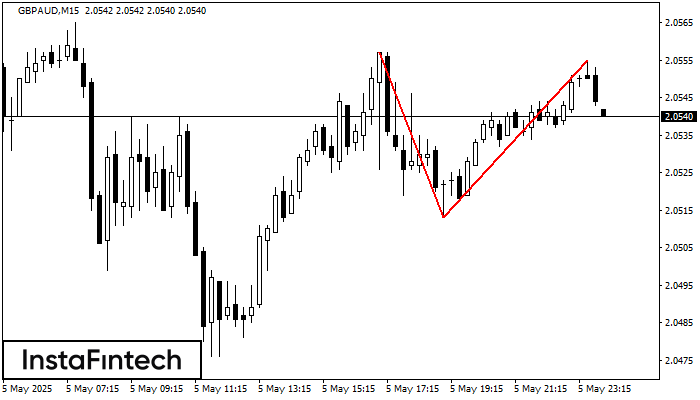
На торговом графике GBPAUD M15 сформировалась разворотная фигура «Двойная вершина». Характеристика: Верхняя граница 2.0555; Нижняя граница 2.0513; Ширина фигуры 42 пунктов. Сигнал: Пробой нижней границы 2.0513 приведет к дальнейшему нисходящему
Таймфреймы М5 и М15 могут иметь больше ложных точек входа.
Открыть график инструмента в новом окне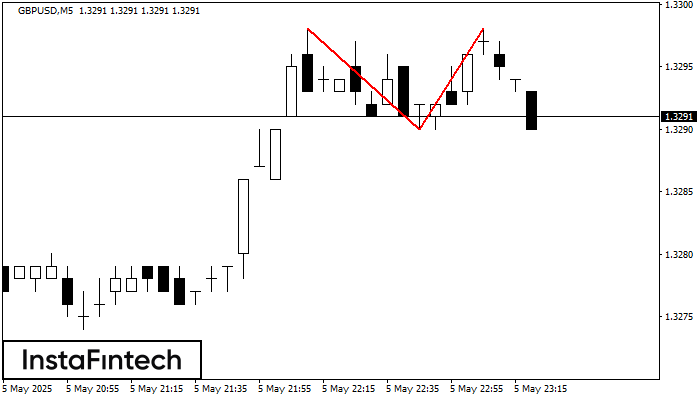
По GBPUSD на M5 сформировалась разворотная фигура «Двойная вершина». Характеристика: Верхняя граница 1.3298; Нижняя граница 1.3290; Ширина фигуры 8 пунктов. Позицию на продажу возможно открыть ниже нижней границы 1.3290
Таймфреймы М5 и М15 могут иметь больше ложных точек входа.
Открыть график инструмента в новом окне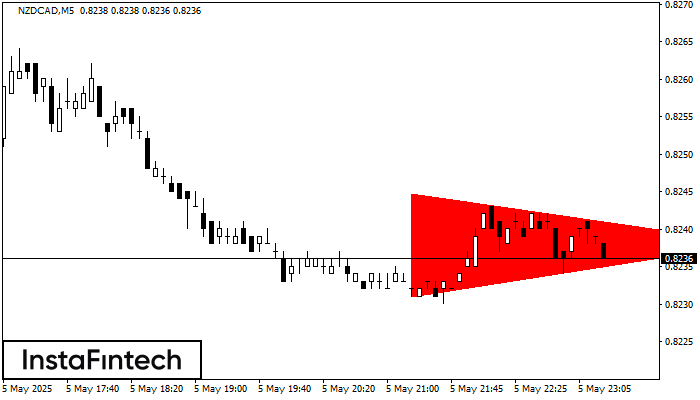
По NZDCAD M5 сформировалась фигура «Медвежий симметричный треугольник». Данная фигура сигнализирует нам о продолжении нисходящего тренда в случае пробоя нижней границы 0.8231, где вероятная прибыль будет являться шириной текущей фигуры
Таймфреймы М5 и М15 могут иметь больше ложных точек входа.
Открыть график инструмента в новом окне


