

signal strength 2 of 5
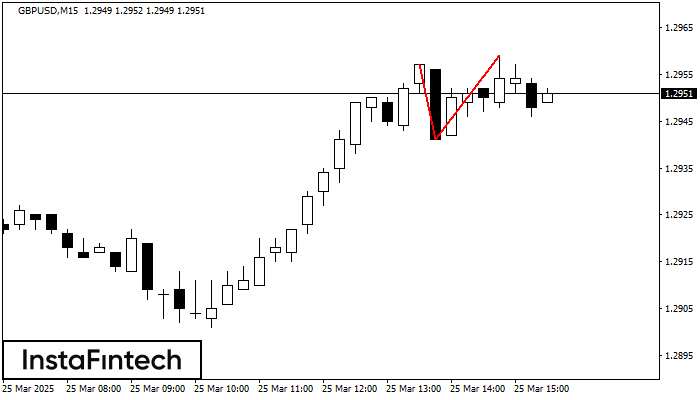
The Double Top reversal pattern has been formed on GBPUSD M15. Characteristics: the upper boundary 1.2957; the lower boundary 1.2941; the width of the pattern is 18 points. Sell trades are better to be opened below the lower boundary 1.2941 with a possible movements towards the 1.2918 level.
The M5 and M15 time frames may have more false entry points.
- All
- Double Top
- Flag
- Head and Shoulders
- Pennant
- Rectangle
- Triangle
- Triple top
- All
- #AAPL
- #AMZN
- #Bitcoin
- #EBAY
- #FB
- #GOOG
- #INTC
- #KO
- #MA
- #MCD
- #MSFT
- #NTDOY
- #PEP
- #TSLA
- #TWTR
- AUDCAD
- AUDCHF
- AUDJPY
- AUDUSD
- EURCAD
- EURCHF
- EURGBP
- EURJPY
- EURNZD
- EURRUB
- EURUSD
- GBPAUD
- GBPCHF
- GBPJPY
- GBPUSD
- GOLD
- NZDCAD
- NZDCHF
- NZDJPY
- NZDUSD
- SILVER
- USDCAD
- USDCHF
- USDJPY
- USDRUB
- All
- M5
- M15
- M30
- H1
- D1
- All
- Buy
- Sale
- All
- 1
- 2
- 3
- 4
- 5

The Triple Bottom pattern has been formed on #Bitcoin M30. It has the following characteristics: resistance level 103658.13/103057.03; support level 102549.85/102590.27; the width is 110828 points. In the event
Open chart in a new window
According to the chart of M5, #Bitcoin produced the pattern termed the Inverse Head and Shoulder. The Head is fixed at 102549.85 while the median line of the Neck
The M5 and M15 time frames may have more false entry points.
Open chart in a new window
The Double Bottom pattern has been formed on #Bitcoin M5; the upper boundary is 103642.04; the lower boundary is 103357.83. The width of the pattern is 27887 points. In case
The M5 and M15 time frames may have more false entry points.
Open chart in a new window


