


signal strength 3 of 5

The Double Bottom pattern has been formed on NZDCAD M30; the upper boundary is 0.8209; the lower boundary is 0.8165. The width of the pattern is 43 points. In case of a break of the upper boundary 0.8209, a change in the trend can be predicted where the width of the pattern will coincide with the distance to a possible take profit level.
- All
- Double Top
- Flag
- Head and Shoulders
- Pennant
- Rectangle
- Triangle
- Triple top
- All
- #AAPL
- #AMZN
- #Bitcoin
- #EBAY
- #FB
- #GOOG
- #INTC
- #KO
- #MA
- #MCD
- #MSFT
- #NTDOY
- #PEP
- #TSLA
- #TWTR
- AUDCAD
- AUDCHF
- AUDJPY
- AUDUSD
- EURCAD
- EURCHF
- EURGBP
- EURJPY
- EURNZD
- EURRUB
- EURUSD
- GBPAUD
- GBPCHF
- GBPJPY
- GBPUSD
- GOLD
- NZDCAD
- NZDCHF
- NZDJPY
- NZDUSD
- SILVER
- USDCAD
- USDCHF
- USDJPY
- USDRUB
- All
- M5
- M15
- M30
- H1
- D1
- All
- Buy
- Sale
- All
- 1
- 2
- 3
- 4
- 5
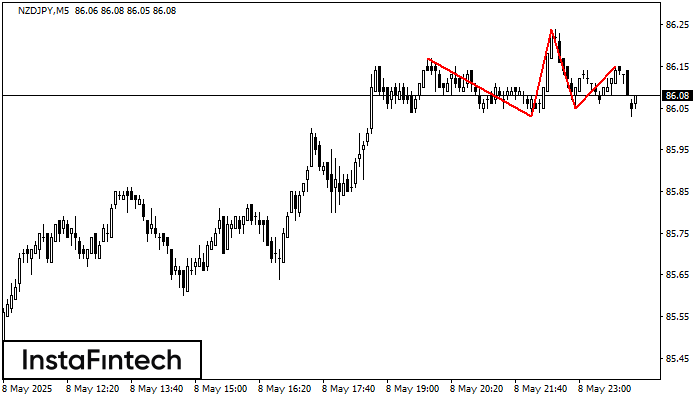
The technical pattern called Head and Shoulders has appeared on the chart of NZDJPY M5. There are weighty reasons to suggest that the price will surpass the Neckline 86.03/86.05 after
The M5 and M15 time frames may have more false entry points.
Open chart in a new window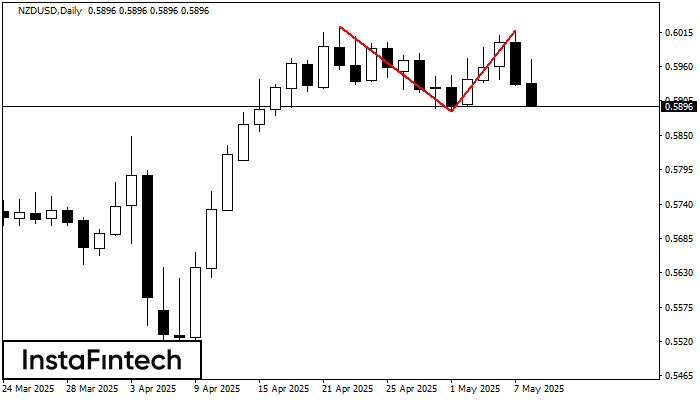
The Double Top pattern has been formed on NZDUSD D1. It signals that the trend has been changed from upwards to downwards. Probably, if the base of the pattern 0.5888
Open chart in a new window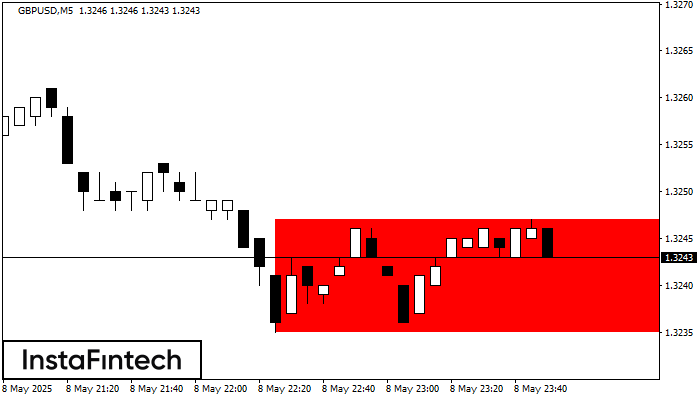
According to the chart of M5, GBPUSD formed the Bearish Rectangle. This type of a pattern indicates a trend continuation. It consists of two levels: resistance 1.3247 - 0.0000
The M5 and M15 time frames may have more false entry points.
Open chart in a new window


